Yonder summary December 2023
For our December survey of members, we received 12,110 responses.
In this survey
- Car buying and finance
- Christmas getaway
- Hiding Christmas gifts
- Road gritting
- Motoring offences
- Rubbernecking
- Car lights
- Driving habits
Car buying and finance in 2024
We wanted to get our members vehicle buying intentions for the coming year.
Two-thirds (67%) planned to keep their current petrol/diesel car in 2024, whereas only 9% had plans to replace their current vehicle with a used vehicle and even less just 5% with a new one.
Of those planning to replace their car 61% would pay by cash; 16% by finance; 8% with a personal loan and just 6% intend to lease a new car.
We also asked our members what services or products they pay monthly for. Half pay for TV or film streaming services; 21% pay for music services and a fifth (20%) newspapers and magazines.
Younger people (25-34) are more likely to have finance on their car with 28% saying that’s how they fund their vehicle, and 13% of those were from Social grade C2.
Christmas Getaway
With the Christmas period traditionally being one of the busiest on the roads, we asked about plans for travel between December 22nd and 27th.
Nearly half (46%) had no plans to travel on a motorway or major A road. 42% did have travel plans.Younger (57%) and middle aged (54%) drivers were more likely to make a journey – the majority (52%) of over 65s were more likely not to travel.
Of those who planned to use a motorway or major A road 16% said they would travel early morning and 15% mid-morning on December 22nd. 15% said they would travel mid-morning on either December 23rd or 27th.
When using major routes, 11% said they allow 2 hours addition travel time; 34% said they gave themselves an hour’s extra time; 28% gave themselves 30 minutes or less and 13% allowed no extra time for their journey.
Hiding Christmas Gifts
We asked where our members planned to hide the Christmas presents they were giving. 29% don’t hide Christmas presents, whereas, of those that do almost a quarter said they hide them in a spare room (22%), and less than one-fifth hide them in the wardrobe (17%).
Road Gritting
When there is heavy snow and/or ice, the road authorities usually keep main routes open but minor routes are often left untreated, we asked AA panel members and drivers based on where they live what they would do if there were any significant ice or snowfall in their area.
Just over a quarter (26%), expect roads between their home and the nearest main road to be left untreated but they would still drive and give it a go and hope for the best, whereas the same proportion (26%) wouldn't use the car until those roads are cleared.
Just under a quarter don’t expect any problems as all the roads they use are usually cleared/gritted (24%).
14% said despite, the roads between their home and the nearest main road not likely to be cleared, they would have to drive because they are expected to go to their place of work regardless of the conditions.
Motoring Offences
In this section, respondents were asked how certain they were that a driver committing certain offences in their area would be caught and punished.
Respondents were certain that the following motoring offences would be certainly caught and punished, driving in a bus lane (25%), speeding (17%) drink driving (14%).
- Getting caught and punished for driving in a bus lane was particularly high for Londoners (43%).
- Getting caught and punished for speeding was particularly high amongst those living in London (22%), Wales (22%) and Yorkshire & Humberside (21%).
- Those who live in Scotland were more likely to be certain drink-driving would be caught and punished in their area (18%).
Offences that were unlikely to be caught and punished according to respondents included; careless driving (tailgating or middle lane hogging) (58%), driving a vehicle in a dangerous or defective condition (50%), driving while using a handheld mobile phone (49%) and not wearing a seatbelt (46%).
Those who live in the West Midlands were more likely to think drivers using mobile phones when driving (53%) and not using a seatbelt (51%) wouldn’t get caught or punished in their area.
Rubbernecking
Rubbernecking is defined as when drivers unnecessarily slow down and stare at a broken-down vehicle or vehicles involved in a collision, despite the fact the road ahead of them is clear.
Our members said they don’t often recall seeing other driver rubberneck – 19% said they see it happen once every 3 months; 17% said they witness it monthly and 15% said around once a year.
When asked if ‘rubbernecking’ should be penalised, 60% believed it should be, with a third (34%) believing a referral to a driver awareness course should suffice.
Whereas, less than a quarter of those surveyed (23%) don’t think rubbernecking should be penalised.
Car Lights
Daytime Running Lights (DRL's) have been a requirement for new vehicles since 2011. However, the law currently only requires manufacturers to fit DRL's to the front of vehicles and in some cases, this has led to drivers believing their headlights are on in darkness when they are not, therefore the rear lights are not illuminated.We asked should it be a legal requirement for all new vehicles to have DRL's at the rear as well as the front. Most respondents do believe it should be a legal requirement (72%). This was significantly high amongst those who live in Scotland (77%).
The AA has received concerns from members regarding 'dazzling'. This is where the use of high-intensity LED (light emitting diode) headlights on modern vehicles causes discomfort to other road users. As well as concerns about ‘dazzling’ from brake lights on new cars. Members advise us that brake lights cause them discomfort when both sat in jams and free-flowing traffic.
A large proportion of those we surveyed had experienced ‘dazzling’ from LED headlights from oncoming cars (76%) with more than half (52%) having been dazzled from cars behind. More than a third have been dazzled by brake lights (36%).
- More than half of AA members and drivers think there should be more regulations for the use of LED headlights (56%).
- The colour of the LED headlights is important for our panel members as more than a third (35%) think LED headlights should be a “warmer” colour (more yellow/ orange) than white.
- Nearly a third (29%) think LED headlights are good for the driver of the car they're fitted to.
In terms of road safety, only 15% think LED headlights improve safety on roads compared to a third (33%) of respondents who think brake lights improve road safety.
When it comes specifically to respondents' views on brake lights, 39% think brake lights are brighter than they used to be.
Despite thinking brake lights improve road safety, just over a quarter of those surveyed think brake lights on modern cars are more objects of style rather than practicality (27%).
Driving Habits
Lastly, we asked which driving habits/techniques they stopped doing first after passing their driving test.
The top 3 habits/techniques respondents stopped doing were, using the handbrake when stationary in traffic (37%), sticking to speed limits (12%) and checking for blind spots (4%).
Women (42%) and those in the middle/older age brackets (35-44 (44%), 45-54 (43%) and 55-64 (42%)) were particularly more likely to stop using the handbrake when stationary in traffic after passing their driving test.
28% said they still drive the same way they did when they passed their test.
Yonder summary November 2023
We ran our poll between 13 November and 21 November and received 12,197 responses.
In this survey
- Breakdown experience
- Used car dealers
- Christmas 2023 plans
- Drink Driving
- Driving in adverse weather
- Retaking a driving test
- Smart motorways
- Injuries from car crashes
- Preparing your home for winter
Breakdown experience
Our first section looked at the situations our members cars have broken down in.
Just over a quarter (26%) said their car has never broken down.
21% responded that their car had broken down on a country road; 20% on a busy motorway and 20% in the dark or at night.
We then asked our members to rate different scenarios to breakdown in from inconvenient to disastrous. The most disastrous situations were:
- In the middle lane of a motorway – 90%
- Enroute to an airport to catch a flight – 81%
- At a level crossing – 81%
Situations seen as just inconvenient were:
- Breaking down at a drive-thru - 38%
- Multi-storey car park -36%
- On the way to watch a sporting event -34%
- On the way to a date - 29%
Used Car Dealers
We wanted our members experiences on using used car dealers.
Over half (58%) said they find the dealer they want online then go in person. Just over a quarter (27%) would base their choice on family or friend recommendation – 48% of women vs 33% of men do this, and 24% would visit a dealership if they saw it had been accredited or approved by an independent organisation.
When asked what kind of research they do on a dealership 59% would check if it had been accredited or approved by an independent organisation – with more women than men (62% v 57%) checking this. 56% would look around their website and just over half (51%) look at reviews on other websites first.
Only just over a third (35%) have returned to a dealership to purchase a second/third successive used car. More than half (53%) haven’t, with 29% going somewhere different every time.
Christmas 2023
We then asked our members about their plans over the festive period.
83% told us they didn’t decorate their cars for Christmas, but of the ones that do 13% of those have a festive playlist or CD they use.
Younger respondents (those aged 25-34) and women are more likely to have a festive playlist (26% and 17%) compared to older (65+) and men (15% and 11%).
43% of those surveyed revealed they love to see outdoor Christmas lights when driving during the festive season. While one in ten (11%) revealed they go on a drive specifically to look at festive lights.
Although, one-third (32%) think outdoor Christmas lights should not be put up before the 1st of December.
More than half (56%) are planning a car journey during the Christmas period (15th December – 3rd January). The dates respondents are most likely to travel on are:
- Friday 15th December (51%)
- Saturday 23rd December (49%)
- Friday 22nd December (48%)
There are different reasons for traveling over the festive season.
- Visiting family and friends is the top reason to travel on Christmas day (25th December) (38%)
- Traveling to and from work is the top reason for travel on Friday 15th December (26%) and Tuesday 19th December (26%)
- Lastly, shopping plans are the top reason for travel on Saturday 16th December (24%) and Saturday 23rd December (23%)
Drink Driving
As drinking increases over the Christmas period, we asked respondents what justifications they’ve heard from drivers after they’ve consumed alcohol:
- Over half (62%), recall hearing “I’ve only had one drink”.
- 41% recall hearing people say “I’ve had food, so that will have soaked the alcohol up” and 40% recall hearing people say and “It’s only down the road”.
- A third (31%) have heard others use “It’s been a while since the last drink” as justification.
Driving In Adverse Weather
With recent poor weather conditions, we wanted to know what weather warnings would prevent our members from driving:
- A red warning for flooding (69%) and snow (67%) would prevent more than two-thirds of respondents from driving.
- A red warning for icy conditions (63%), fog (60%), and strong winds (59%) would prevent three-fifths of those asked from driving.
- Over a third, wouldn’t drive if there was an amber warning for snow (38%) and flooding (36%)
- One-third (34%) wouldn’t drive if there was an amber warning for icy conditions.
Respondents said they would still drive in a heatwave (59%), in frost (40%), and in a thunderstorm (39%) regardless of the weather warning.
Driving Test Re-takes
A common suggestion to improve road safety is for drivers to retake their test once they hold a full license. We asked members and drivers for their thoughts on this.
Half think drivers should only retake a test when requested to for health and driving offense reasons (51%). This was highest amongst those aged 66+ (60%).
It seemed, that respondents thought that drivers should be tested again once they reach a certain age.
- With nearly a quarter (23%) thinking drivers should be tested once they reach 70. This increased to 27% once drivers reach 75 years of age.
- Younger respondents (aged 25-34 and 35-44) were more likely when compared to the average, to think drivers should retake their test once they reach 75 years of age (35% and 28% vs 27%).
Smart Motorways
We asked respondents what they think should be done to the existing ‘All Lanes Running’ network of ‘smart’ motorways.
Just over half (57%) think the ‘all lane running’ network should be converted back to a traditional three-lane motorway with a permanent hard shoulder.
One in 10 (11%) thought the all-lane running network should be converted into “controlled motorway schemes”.
A similar number thought it should be converted into a “dynamic hard shoulder scheme” (10%) or the network should just be left as it stands (10%).
Car Crash Injuries
We asked our members to imagine being involved in a car crash which resulted in the following types of injury and asked if they would be more concerned with their physical wellbeing and or mental wellbeing post collision.
Unsurprisingly, respondents were most concerned about their physical well-being if they experienced whiplash (58%), a punctured lung (52%), or a fractured arm/leg (59%).
Concussion (53%), severe shock (50%), and a punctured lung (45%) would be equally concerning both physically and mentally for around half of those we surveyed.
Concern for mental well-being was highest for severe shock (34%) and slight shock (30%).
Men are more concerned with their physical well-being than women if they experience any of the following injuries:
- Whiplash (62% of men vs 51% of women)
- Fractured arm/leg (63% of men vs 51% of women)
- A concussion (38% men vs 32% women)
- A punctured lung (56% men vs 43% women)
Whereas women tend to be equally concerned for both their physical and mental well-being for the following injuries:
- Whiplash (43% of women vs 29% of men)
- Fractured arm/leg (45% of women vs 30% of men)
- A concussion (61% of women vs 49% of men)
- A punctured lung (55% of women vs 40% of men)
Winter Home Preparation
With the arrival of winter, we asked members what they had done to prepare their homes for the cold season.
More than half (55%) have had their boiler serviced, especially older respondents (aged 65+) (63%) and those in social grade AB (59%).
40% have already put outdoor furniture away, whilst more than a quarter have protected/covered their outdoor furniture (27%) ahead of the colder months.
37% have cleaned their gutters/downpipes, especially those living in Northern Ireland (50%*), Wales (42%) and the South West (42%).
Just over a third have tested smoke alarms (35%) and bled their radiators (33%).
Yonder summary October 2023
In October’s survey we received 11,678 responses to our poll which ran between 6 and 17 October.
In this survey
- Connected Cars
- Drivers Priorities Facing The UK
- Net-zero and ICE Sale Ban
- Barriers To EV Ownership
- The AAs Role in Transitioning to EV
Connected Cars
Our first subject was looking at connected cars – these are cars which are equipped with internet access and can send and receive data about the vehicles condition, status and some user preferences.
87% of respondents said they would be willing the share data if their car broke down and the roadside assistance required it to help locate them and to help diagnose remotely. 71% would share data if it helped them get insurance based on how many miles they drive – this rose to 76% in the over 65s and 77% in social-economic groups DE.
Respondents were least likely to share their data to sync their contacts from their phone with 62% saying they wouldn’t, and 42% wouldn’t share to support eco-driving in real-time.
Drivers Priorities Facing The UK
We wanted to find out the most important issues our members think the UK is facing right now.
The top-ranking issues were:
- Health & the NHS (85%)
- Cost of living (70%)
- The economy (57%)
The issues facing health care and NHS were particularly important for women (91% vs 83% of men), as was the cost of living (74% vs 68% of men). However, the economy was more important for men than women (59% vs 51%).
When asked what transport measures they support or oppose the most, the majority of respondents supported increased investment in repairing and upgrading roads (e.g. fixing potholes) (96%) and increased investment in the public transport infrastructure (83%).
Nearly three quarters (72%) said they were opposed to allowing more micro-mobility such as e-scooters onto the roads. Nearly half (48%) were strong opposed to allowing self-drive cars on the road.
Net-Zero and ICE Sale Ban
With the UKs commitment to net zero by 2050, we asked our members about their thoughts towards being more environmental.
80% agreed that to reach net zero we need to protect our natural environment, but 72% don’t believe the UK will reach that target.
Three quarters (76%) think there should be more focus on reducing emissions to produce electricity so more wind and nuclear power; less from oil and gas.
In terms of how driving can help reach net zero just over a third (36%) disagreed that the UK moving from internal combustion engines to EV is important in reaching net zero.
Three quarters of our members surveyed agreed with the recent delay from government on banning sales of petrol and diesel vehicles which now comes in 2035 rather than 2030. A quarter don’t agree with this delay.
Of the people who agree with the delay the main reasons for agreeing were:
- Charging infrastructure isn’t in place (28%)
- EVs aren’t as green as they are made out to be (23%)
Those opposing the delay felt that we need to commit to policies which support net zero (40%) and that changing the deadline was confusing to both business and individuals (23%)
Barriers To EV Ownership
We asked our members to rank the importance of the following measures if they were thinking of switching to an EV:
- Increased investment in charging infrastructure – 43%
- Financial incentives – 32%
- More information and support – 25%
In terms of financial incentives our members would like to see:
- EVs to remain exempt from car tax – 35%
- A 0% interest loan to purchase the EV over 3-5 years – 32%
- A scrappage scheme like the 2008 diesel scrappage scheme – 31%
Moving to the EV infrastructure, the top three incentives were:
- Ensuring EVs have the range to complete longer journeys – 43%
- More public charging points – 40%
- Ensuring that charging is quick and easy on public points – 28%
And lastly, when asked to think specifically about the information they wanted that would encourage them to make a switch to an EV, respondents wanted:
- More information on the costs associated with owning an EV - 50%
- More information on public chargers and charge point operators - 40%
- More information on the range of EV vehicles - 28%
The AAs Role in EV Transition
We asked our members how they would like the AA to support them if they were to switch to and EV vehicle.
The majority (90%) would like to AA patrols to have specific knowledge and the ability to fix their EV if it breaks down, and 79% want The AA to have the skills and capacity to maintain and service their EVs.
88% want the AA in general to have a high knowledge of EVs.
Just over 80% would like The AA to work with charging point operators to make sure the network is reliable.
83% said The AA should actively challenge misinformation on EVs; three quarters said we have a responsibility to provide accurate information and 67% said The AA should be campaigning for better EV infrastructure.
Yonder summary September 2023
There were 13,400 responses to the AA Yonder August survey between 11 and 19 September 2023.
In this survey
- Tailgating
- ICE or Electirc Cars
- New or Used Cars
- Holiday Motoring Offences
- Irritating Drivers
- Private Parking
Tailgating
Our first section was about tailgating. Recent official statistics show that more than 20% of cars and vans don't follow the Highway Code's guidance to leave a two-second gap on fast roads between them and the vehicle in front. We asked our members what they do:
More than half (65%) were aware of the two-second gap and stick to it all the time. Interestingly more women than men are more likely to stick to this rule (70% women vs. 62% men)
ICE or Electric Cars
In previous surveys, some members have told us that they are reluctant to buy an Electric Vehicle (EV) when they are looking to replace their existing car. This next section asked respondents who drive why they’d choose to own an Internal Combustion Engine (ICE) vehicle over an EV. The top reasons were:
Nearly half (48%) don’t believe there are enough public charging points, and that they are too expensive compared to their budget (47%)
There was concern about how long an EV takes to charge – a third of respondents said recharging was too slow, and a quarter (26%) said an EV could not travel the distances without stopping to recharge on long trips.
New vs Used Cars
We moved onto asking about car buying decisions. We asked our members if they were to buy a vehicle in the next 12 months would they buy a new or used car and how would they fund the purchase.
Nearly three quarters said they would buy a used car and just over half would pay in cash. Almost a quarter would buy a brand-new vehicle and 15% of these would fund it in cash rather than finance.
4% would look at leasing a new or used vehicle.
We then asked if our members would have brought a vehicle the previous September (2022) would it have new or used and how would it have been funded. Results were very similar to the previous questions – 73% used and 55% using cash; 24% new with 14% using cash; and 3% leasing.
Holiday Motoring Offences
As it was the end of the holiday season, we asked our members if they had received a motoring-related ticket or fine this summer.
96% said they hadn’t with 4% saying they had in either the UK or whilst driving abroad.
Of those who had received a ticket abroad 43% said it was for speeding, and 39% for parking related offences. In the UK parking was the highest number recorded (39%); followed by speeding at 36% and 14 % said they’d had a ticket for driving in a bus lane.
Irritating Drivers
We moved onto asking about other driver’s behaviours which irritate our members.
The top irritant was driving with full beam lights when passing other cars (87%); with both not stopping for emergency vehicles and not using indicators scoring 86% each.
Further down the list were tailgating (29%); middle lane hogging (21%) and using a handheld mobile phone (21%).
We asked how often our member witness other drivers demonstrating certain behaviours: two thirds said they had witnessed tailgating; 63% not using indicators; and 60% lane hogging. The least witnessed actions were: driving away after hitting another vehicle (88%) shouting at a passenger (76%) or splashing a pedestrian (68%)
Just over half said they see other drivers thanking other motorists which is a positive.
88% of our member consider themselves to be a polite driver with more women higher at 92% than men at 86%.
When looking at drivers of specific vehicles just over half (56%) said they considered lorry drivers demonstrated good road manners and just under half (49%) considered other car drivers have good manners. Half felt most can drivers do not demonstrate good road manners.
Private Parking
We wrapped this month’s survey up on the topic of parking in a car park.
We asked what the most important factors were when choosing where to park. The highest scorers were proximity to location and cost both scoring 56%; a well-lit car park scored 49% and a period of free parking 48%.
Cheap parking was a high scorer in the 25-34 age group with 68% of responders saying it was important to them.
Different ways of paying for parking came out differently in different age groups. 53% of respondents aged over 65 wanted the ability to pay in cash, whereas contactless payment scored highly in the 25-34 age bracket (48%).
If paying by app was the only option for payment nearly half (48%) said they would look for somewhere else to park – in the 65+ age group, this rises to 57%.
Nearly three quarters (73%) thought a fine ranging from £101-110 would be an appropriate level if you overstay, but 26% think it should be between £41 and £50. 17% of those surveyed didn’t think there should be any fine at all for overstaying.
Private car parks currently use debt recovery agencies and the county court system to recover debts. More than half (56%) thought this was unacceptable; in the 35-44 ages this was higher at 62%. 21% thought that using the court system was ok but not debt recovery agencies, but 14% thought using both methods was ok.
Yonder summary August 2023
There were 12,903 responses to the AA Yonder August survey between 11 and 21 August 2023.
In this survey
- Driving test knowledge
- Windscreen insurance
- Prioritising motoring topics
- EV incentives
- Packing the car
- Bank holiday travel
- Re-arranging plans due to poor weather
- MOT and servicing
- Remote car shopping
Driving test knowledge
We opened the August survey by asking respondents if they had to retake their practical and theory driving tests today, how confident they would. Most said they would be confident to pass their practical test (84%) whereas, less felt confident they would pass their theory test (56%).
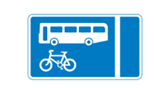
We went on to ask about our respondents about road signs
Almost two-thirds (63%) of respondents rarely encounter road signs they don’t know the meaning of but, a quarter (25%) shared that sometimes they don’t know the meaning.
Almost nine in ten (87%) of respondents correctly indicated that the image below meant ‘with- flow bus and cycle lane”.
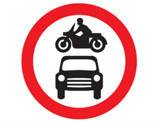
More than three quarters (76%) correctly identified the “no motor vehicle access” sign below, however, one in five (20%) thought this indicated “access only for cars and motorbikes”. 18-24s were more likely to make this mistake than over 65s (47% versus 18%).
Windscreen insurance
We then went on to ask respondents whether they believed windscreen insurance was important.
More than four in five (86%) felt that windscreen insurance was important, with three in five (59%) considering this to be very important and over a quarter (27%) considered this slightly important.
Prioritising motoring topics
We next asked our members to put into order of importance a number of motoring topics, from a given list. The top answers were:
- Fixing potholes (28%)
- Cost of motoring (e.g. fuel prices, public charging costs, vehicle excise duty, fuel duty) (23%)
- Tackling driving offences (e.g. speeding, drink driving etc.) (13%)
EV incentives
In previous surveys, respondents have shared that the initial purchase price of an electric vehicle is a barrier to ownership. We asked our members what incentives might encourage them to make the switch to an EV.
Whilst a third (33%) said they would never buy an EV, removing VAT from new EV sales (31%) was seen as the top financial incentive.
The following were also seen as good incentives to help encourage switching:
- A scrappage scheme (similar to the 2008 diesel scrappage scheme) (29%).
- A 0% interest loan over 3-5 years (29%)
- Removing VAT from used EV sales (27%)
- Reinstating the £3,500 plug-in grant on new vehicles less than £35,000 (26%)
Packing the car
The next section asked members about the occasions when they tended to pack their cars full.
Unsurprisingly, most respondents tended to pack their car when going on holiday (62%). This was followed by going to the recycling centre/tip (61%).
Lastly, respondents tend to pack their car full when collecting a large load from a DIY/furniture store or when moving homes (both 32%).
Banking holiday travel
Respondents were then asked what their travel plans were for the August bank holidays and what distance they expected to travel.
Around 30-37%, said they are not planning to drive at all during the bank holiday dates:
- Friday 25th (30%)
- Saturday 26th (33%)
- Sunday 27th (35%)
- Monday 28th (37th)
Of those who are planning to drive during any of the bank holidays, more than half expected to travel under 50 miles on:
- Friday 25th (56%)
- Saturday 26th (55%)
- Sunday 27th (53%)
- Monday 28th bank holiday (50%)
Re-arranging plans due to poor weather
Respondents were asked if they have or if they knew anyone who cancelled/put off plans for a day trip, short break (2-3 days) or a holiday (more than three days) in the UK as a result of the poor weather.
One in five (20%) respondents said they had to cancel or know someone who has cancelled a day trip in the UK because the weather was poor.
Less than 1 in 10 have themselves or know someone who has cancelled plans for a short break (9%) or a holiday in the UK due to poor weather (5%).
MOT and servicing
More than a third of respondents (36%) check the basics such as tyres, lights, and oil/coolant levels before putting it in for an MOT.
A quarter (24%) don’t check their car at all, whereas, a fifth (21%) get someone else to check over the car (e.g. a garage, family or friend)Just over one in ten (12%) give the car a thorough check themselves before putting it in for the MOT.
Most respondents (77%) said it was unlikely they would have their vehicle serviced at home or at work, with half stating it would be extremely unlikely (51%).
Older age groups (65+) were less likely to want to do this (84%) than those under the age of 34 years old (60%).
One in ten (12%) are likely to have their vehicle serviced at home or work rather than taking it to a garage or dealership.
Remote car shopping
The final section of the survey asked respondents whether buying a car without viewing it in person offered value for money and the assurances they would look for to make them feel that the business was reputable and trustworthy.
Two in five respondents (43%) think buying a vehicle without viewing the car in person doesn’t help give them any value for money for the following reasons:
- It wouldn’t give respondents value for their money as they aren’t able to haggle (27%):
- Respondents just assume dealers would just up the price (21%).
The same proportion (21%) believe it depends on where the dealership is located and what the car sells for in the local area.
Three in five respondents (61%) said they wouldn’t buy a car without visiting the dealer first to make their assessment.
Of those who would consider it, around 1 in 5 said they would do the following to reassure themselves that the business they were purchasing from is reputable and trustworthy.
Yonder summary July 2023
There were 12,598 responses to the AA Yonder July survey between 18 and 25 July 2023.
In this survey
- Green home improvements
- Alternative transportation
- 20mph speed limits
- EV concerns
- Fixed car pricing
- Stopping distances
- Journey preparations
- First aid
- Rail strikes
- VED luxury rates
- Dashboard warning lights
- Chinese EV manufacturing
Green home improvements
This month’s survey started exploring how likely AA members were to consider installing different potential home improvements to their home if they had not already:
- Loft insulation was most likely to have already been installed by two-thirds (66%), followed by cavity wall insulation (45%).
- Of those who had not already installed, replacing doors and windows (7%), solar panels (5%) and replacing boiler (5%) were most actively being considered.
- Over three in five would not consider adding a heat pump (68%), EV charger (65%) or replacing paving/artificial grass to grass/soil (63%).
Alternative transportation
Then the survey moved on to asking whether AA members have been replacing car journeys with other alternative modes of transportation.
Over one in ten stated they have replaced a car journey by walking on a daily basis (13%), this increased to one in five a few times a week (21%). Hardly anyone swapped a car journey with an E-scooter (2%), however, 18-24-year-olds were the most likely to do so of any age group (14%).
20mph speed limits
Across Wales, Scotland and parts of London, 30mph roads are having their speed limits reduced to 20mph to make the roads safer and improve air quality, although some argue this is ‘anti-car’ and will increase journey times.
Over half (53%) agreed that 20 mph roads work best when they are only applied to roads where it offers protection to community assets (outside schools, GPs etc).
Around two in five can see both points of view, with one in ten supporting this measure (13%), and a further one in ten opposing this measure (10%).
One in seven (14%) felt that reducing the speed limit will make roads safer and improve air quality and should be welcomed
However, over three in five stated that they would be unhappy (64%) if all 30mph roads in their area were reduced to 20 mph, particularly those aged 18-34.
EV concerns
The survey continued to look at what the biggest concerns are for electric vehicles.
Around half stated the top 3 concerns were:
- There aren’t enough charging points in the UK (54%)
- Worrying about the battery running out while on a journey (50%)
- Too expensive to buy outright (48%).
Fixed car pricing
Car manufacturers like Mercedes and Volvo are introducing standardised pricing on vehicles across new car dealerships, meaning buyers will not be able to haggle.
Over a quarter (28%) agreed that this has been introduced to raise carmakers’ profits and a fifth (22%) of AA members stated they would be less likely to buy a car sold through standardised pricing. Nevertheless, 1 in 4 (26%) stated that this will not affect them.
Stopping distances
Next, AA members were tested on whether they knew the stopping distances of a vehicle in dry road conditions. The stopping distance of a vehicle is the thinking time and the overall stopping distance combined.
Overall, the stopping distances were over-estimated. Members were more likely to correctly identify the stopping distances of the slower speed compared to faster speeds.
| Speed (MPH) | Overall stopping distance (m) | % correctly identified | Average distance selected (m) |
| 20mph | 12m | 38% (11m-20m) | 28m |
| 30mph | 23m | 31% (21m-30m) | 41m |
| 40mph | 36m | 28% (31m-40m) | 55m |
| 50mph | 53m | 24% (51m-60m) | 69m |
| 60mph | 73m | 24% (71m-80m) | 82m |
| 70mph | 96m | 23% (91m-100m) | 97m |
Journey preparations
The next section focused on how our members prepare for long car journeys.
Over four in five (83%) reported they fill their vehicle up with fuel and over two in three check tyre pressures (69%) and check windscreen washer fluid (66%). Younger age groups are less likely to check tyre pressure or windscreen washer fluid than older age groups.
Those under 34 were more likely to set up navigation, check that their phone has connected to the car and make sure they have the right playlist for the journey compared to those over 35.
This question was followed by asking what items they kept in their car. Over half kept a car jack (68%), spare tyre (65%), mobile phone charger/cable (60%), sunglasses (58%) and the car manual (57%) in their car.
Less than four in five kept their insurance certificate (18%) or proof of MOT (9%) in their car.
First aid
AA drivers were then asked whether they had any medical/first aid training. Half reported they had attended a basic first aid course (48%) while 3 in 10 (29%) have no medical training.
Then different scenarios were given, and they were asked how prepared they would be to assist:
- Two in five would be willing to help with non-life-threatening injuries (39%).
- Two in three would help with major injuries (30%) – especially those aged 25-64 years old (41%).
- Just under one in four would be willing to help with cuts and bruises(23%).
- Less than one in ten would not want to get involved at all to help (9%).
Rail strikes
In recent months it has been widely reported that industrial action by the rail unions have been taking place. A quarter stated that they have been put off taking a trip because of train strike action (25%). Of those affected, two-thirds were for leisure trips (83%) and a quarter (31%) for work trips.
This disruption was more likely to have an impact on younger people than those who were older.
VED luxury ratesThe survey changed topics to explore VED luxury rates. For vehicles with a ‘list price’ (the published price before any discount) of more than £40,000 registered on and after 1st April 2017, pay an extra £390 a year for 5 years after the first year in Vehicle Excise Duty (VED) (otherwise known as road tax).
(84%) of respondents do not need to pay this ‘Luxury car tax’; with only 5% stating they pay this. Less than 1 in 10 (7%) used to pay this tax but do not need to anymore as the vehicle is older.
The ‘Luxury Car Tax’ has remained unchanged since 2017; a quarter (28%) believes the list price which triggered the luxury car tax should be increased, while just over one in ten (12%) believe the list price should be decreased.
Just under a quarter (23%) believes the list price which triggers the luxury car tax should stay the same. However, over a third (37%) were unsure if this value should be amended.
Dashboard warning lights
Respondents were asked to imagine they were driving on the motorway and the following warning lights came on the car’s dashboard with no symptoms and selection what action they would take.
| Warning light | What it means | Most common actions | Warning light | What it means | Most common actions |
 |
Anti-locking brake system fault | 27% - Check vehicle handbook when safe to do and decide from there. 25% - Recognise light, once at a safe location call for assistance. |  |
Speed limiter engaged | 45% - Check vehicle handbook when safe to do and decide from there. |
 |
Coolant temperature warning | 26% - Recognise, stop immediately and call for assistance. 25% - Check vehicle handbook when safe to do and decide from there. |  |
Traction control system disengaged | 33% - Check vehicle handbook when safe to do and decide from there. |
 |
Parking brake warning | 38% - Check vehicle handbook when safe to do and decide from there. |  |
Traction battery warning | 29% - Check vehicle handbook when safe to do and decide from there. 25% - Recognise light, once at a safe location call for assistance. |
 |
Oil level warning | 31% - Check vehicle handbook when safe to do and decide from there. 29% - Recognise light, once at a safe location call for assistance. |  |
Traction motor temperature warning | 29% - Check vehicle handbook when safe to do and decide from there. 25% - Recognise light, once at a safe location call for assistance. |
 |
Charging system warning | 32% - Recognise light, once at a safe location call for assistance. 24% - Check vehicle handbook when safe to do and decide from there. |  |
Oil pressure warning | 33% - Recognise light, once at a safe location call for assistance. 30% - Recognise, stop immediately and call for assistance. |
Chinese EV manufacturing
The survey ended by exploring electric car manufacturing in China, these manufacturers include NIO, BYD and GWM which are starting to enter the UK car market offering vehicles at various price points.
Over half (55%) stated that they would not be interested in purchasing a car from these manufacturers compared to ‘well-known’ brands such as Ford, Jaguar and Volkswagen.
Only just over one in ten (13%) would be interested, while a fifth (21%) were undecided on whether they would purchase one of the Chinese EV vehicles.
BACK TO TOPYonder summary June 2023
There were 11,565 responses to the AA Yonder June survey between 12 and 20 June 2023.
In this survey
- Electric vehicle views
- Travel insurance
- VAT on EV charging
- Used car checks
- Future road safety
- Dog transport
- Driving test waiting times
- Summer driving behaviours
Electric vehicle views
This month’s survey opened up with a variety of statements about electric and petrol cars, with respondents asked to agree or disagree depending on how they felt. AA members agreed most with the following three statements:
- Electric cars are too expensive to purchase (87%).
- I'm concerned about running out of charge with my family in the car (73%).
- The public charging infrastructure is unreliable (70%).
The respondents disagreed most with the following three statements:
- There are enough public charging points across the UK (75%).
- The government is right to ban the sale of new petrol cars for 2030 (66%).
- I feel confident about buying a used electric car (65%).
The survey continued with asking respondents about what was stopping them from purchasing an EV. EVs being too expensive was the biggest drawback, with 83% of panellists citing this as a reason. This was followed by the lack of confidence in the UK charging infrastructure (76%), and concerns with EVs running out of charge when the car is full with family (60%).
Travel insurance
Next, we asked about members holidays, starting off with at what stage they would buy Travel Insurance. Half of respondents (50%) conveyed that they would buy it at the same time as when they bought the holiday. 14% of respondents stated that they actually never buy travel insurance.
This question was followed by asking respondents what security precautions they take to protect their home whilst on holiday. Over half of panellists ask their neighbour to keep an eye on the house (51%), whilst just over a third give their keys to family/ friends who are not their neighbours (36%).
VAT on EV charging
As Domestic electricity costs are charged VAT at 5%, but 20% at charge points, respondents were asked whether they felt it should stay at 5%. Over half agreed that it should be 5% (56%), around a fifth disagreed (22%) and a fifth were unsure (23%).
Used car checks
Panellists were asked what mechanical components they thought are most commonly found to have problems in used cars. A quarter thought that brakes were the biggest problem in used cars 24%, followed closely behind with a fifth stating electrical system problems (23%) and then tyres (22%).
Remaining on the topic of used cars, respondents were asked about when purchasing one, whether they would they open the bonnet to inspect, and if so, did they know what they were looking for. 85% highlighted they would open the bonnet, however, only 38% conveyed that they would know what they were looking for.
Future road safety
Our members were then asked about the future of mobility, and what they thought should be the biggest priority for policymakers. The two most selected options were:
- Investment in transport alternatives such as public transport (27%).
- Investment in the road network (27%).
Panellists were asked whether they thought the roads would be safer in 10 years’ time. An overwhelming majority of respondents said no (61%), with only 15% of respondents believing that roads will be safer in 10 years.
Dog transport
The topic of the survey changed, as members were asked about how the extreme heat last summer impacted their dogs whilst they were in the car. Three-quarters of respondents did not have a dog (75%), however, out of those who did, 15% highlighted that they became more careful when walking their dog on hot surfaces.
9% of respondents are taking more in-car precautions when transporting their dog, which includes using the air con more, or providing more water.
Those who highlighted that they were dog owners were then asked about how safely they transported their pet in a car. Over half of dog owners stated that their dog wears a harness when travelling in a car (51%).
Over four in ten (42%) of respondents stated that their dog is trained enough in public places to wait until being secured properly, whilst 32% suggested that their dog is trained enough to not distract the driver.
Driving test waiting times
Members were then asked a series of questions about driving test wait times, beginning with what they thought was an acceptable wait time.
The majority of respondents (53%) thought that 4- 6 weeks was acceptable, with 20% believing that it should be less (up to 3 weeks).
As the average is currently 4 months, respondents were then asked how this would impact parts of their life.
Nearly four in ten suggested that their independence would be impacted (38%), which three in ten (30%) said that it would affect their enjoyment.
20% of respondents highlighted that it would impact their health appointments.
Remaining on the topic of the average wait time of 4 months, respondents were asked if about how they would have felt in response to a variety of statements.
Just over a quarter of respondents (28%) suggested that they would have felt extra pressure to pass, whilst 25% would have been concerned that their theory test would expire.
Just over a fifth (22%) would have looked for alternative ways to book a test.
Summer driving behaviours
The survey concluded by asking respondents about what they had seen whilst being a passenger in someone’s car during the summer.
An overwhelming majority had seen very loud music played (83%), nearly three-quarters had seen littering from a car (73%) and nearly 6 in 10 (57%) had seen front passengers putting their feet on the dashboard.
BACK TO TOPYonder summary May 2023
There were 12,225 responses to the AA Yonder May survey between 16 and 23 May 2023.
In this survey
- Used electric vehicles (EVs)
- Learning about EVs
- Bank Holidays
- Graduated driving licences
- Young drivers
- Home improvements
- National Park parking costs
- Driving offences
Used electric vehicles (EVs)
Previously we asked the panel about barriers preventing them from switching to an electric vehicle (EVs) and incentives to encourage them to change to electric car ownership. This month we focused on used EVs.
Members were asked about how they felt about buying a used EV compared to a new one by choosing from a list of statements. The barriers to buying a used vehicle were concerns about the battery, the lack of knowledge on how to check the condition of the vehicle and the range of EV models available. Specifically, the three most selected statements were:
- I don't want to buy a used one in case the battery loses its ability to hold its charge (45%)
- I wouldn’t know how to check if a used EV was mechanically sound (44%)
- Used models won’t have as good a range as the new models (33%)
When asked about when they would be ready to buy a used EV, almost half of AA members said that they would be ready after 2 years (47%), however over a third stated that they would never be ready (35%).
Only 7% of respondents said that they would buy an electric car now if they needed to replace their current one.
Learning about EVs
Next, we asked about whether all learner drivers should learn about EVs and two-thirds agreed they should (62%), while nearly a fifth of panellists believed that only those learning to drive in EV’s should learn about them (18%).
One in ten were either unsure (11%) or disagreed that all drivers should learn about EVs (9%).
Continuing on the topic of knowledge about EVs, two-fifths agreed that driving and running an electric vehicle requires specific knowledge, in comparison to driving a combustion engine vehicle (40%). A third of members said specific knowledge or skills are not needed (33%), and just over a quarter did not know (26%).
Members who answered yes to the previous question were then asked what specific knowledge and skills they thought drivers needed to run an EV. The top three most selected options were:
- Learn about public chargers and Chargepoint operators (86%).
- Understanding range (85%).
- Understanding charging speeds (79%).
Bank holidays
In the next part of the survey, AA members were then asked about their plans for the last bank holiday in May. Members who drive were asked on which day, if any, they were planning to make a journey by car.
On all three days, the top three options were:
- I won’t be driving on this day (48% to 53%)
- Driving somewhere else or not decided (24% to 27%)
- Driving to visit friends or relatives (9% to 12%)
More than half (53%) stated that they did not have plans to travel by car on Monday 29th May. Members were most likely to drive to visit friends or relatives on Saturday or Sunday (12% on each day).
Members were then given a list of statements to choose from to describe how their bank holiday plans went (if they had any).
Seven in ten (69%) did not go on a trip during either of the bank holidays. Out of those who did have plans, one in six (16%) of members’ trips went fairly smoothly and to plan, with only a small minority (4%) running into a severe traffic jam.
Graduated driving licences
In this part of the survey, motorists were introduced to the idea of ‘Graduated Driving Licences’, which includes ideas such as new drivers not being allowed to drive with young passengers for a fixed period of time after passing their test.
Members were given options and asked which methods of Graduated Drivers Licence they thought should be introduced. Whilst two-fifths (41%) said that they did not think that there should be any additional restrictions, out of those who did, the top 3 selected options were:
- New drivers under 25 should not be allowed to carry passengers under 21 for the first 6 months after passing their test (19%)
- New drivers under 25 should not be allowed to carry passengers under 21 for the first 12 months after passing their test (18%)
- All new drivers, regardless of their age, should not be allowed to carry passengers under 21 for the first 6 months after passing their test (13%)
Young drivers
Continuing the topic of driver experience, respondents who drove were given a list of statements regarding near misses and crashes and asked which (if any), applied to them as young drivers.
80% of respondents said that none of the statements about near misses or crashes applied to them. Of the statements which were chosen by a small proportion, the most common statements selected were to do with those under 25 having near misses or crashes as young drivers within one year of passing their driving test, as follows;
- I had a near miss as a young driver (under 25) within 6 - 12 months of passing my driving test (6%)
- I was involved in a crash as a young driver (under 25) within 6 - 12 months of passing my driving test (5%)
- I had a near miss as a young driver (under 25) within 6 months of passing my driving test (4%)
- I was involved in a crash as a young driver (under 25) within 6 months of passing my driving test (3%)
Home improvements
Members were asked about potential home improvements that might be carried out this year. The top three options selected, aside from none (44%), were:
- Painting and decorating one or more rooms (39%)
- Renovating/ redesigning the garden (16%)
- Replacing an existing bathroom or an en-suite (8%)
National Park parking costs
When visiting National Parks in the UK, nearly a third of AA members conveyed that they would consider paying £1.01 - £2.00 to pay for parking (29%), whilst just over a quarter suggested that they would consider paying up to £1.00 (27%).
14% of respondents highlighted that they do not visit national parks.
Driving offences
The survey then went onto ask members about driving fines and offences. Respondents were given a list of scenarios and were asked whether they thought it was true or false that they could receive a fine for each scenario.
99% of respondents thought that the following statements would result in a fine:
- Driving above the speed limit (speeding)
- Using a mobile phone while driving
- Failing to wear a seatbelt
- Driving without a valid licence
- Driving without insurance
- Driving under the influence of drugs or alcohol (over an illegal limit)
- Driving when disqualified
Fewer drivers thought that they would receive a fine for the following scenarios:
- Cursing or making rude gestures at fellow motorists (39%)
- Splashing a pedestrian by driving through a puddle (55%)
- Beeping your horn whilst stationary (where no danger is present) (56%)
An overwhelming majority of respondents would feel guilty about splashing a pedestrian (93%), and the same proportion (93%) denied that they beep their horn at other drivers out of anger or frustration.
Seven in ten members (70%) have had their vehicle damaged by another vehicle whilst parked, and three in five have had their parked vehicle damaged whilst in a supermarket (60%).
More than half said that they had committed an offence and not been caught, (54%), they had committed an offence without realising (54%) or they had committed an offence and had been caught (54%).
Less than one in six respondents (15%) received the contact details from someone who damaged their car whilst parked, while the majority (85%) did not.
BACK TO TOPYonder summary April 2023
There were 13,364 responses to the AA Yonder April survey between 5 and 19 April 2023.
- Car features
- Motorway lane discipline
- May Bank Holidays
- Driving test ambitions
- Location services
- Vehicle tech use
- City mobility
- Technology in transport
Car features
We opened this month’s survey by asking drivers and AA members what features they felt were important when purchasing a car.
Parking sensors are a ‘must have’ car feature for drivers if they were to purchase a new car (60%). Almost two in five (38%) say they couldn’t live without this in their current car.
A sat nav is the next most sought-after car feature, almost three in five (57%) report this as a ‘must have’ feature for a new car and a third (33%) say they also couldn’t live without this in their current car.
However, the perceived need for a sat nav varies based on age; older motorists (55-64, 54%; 65+, 64%) are significantly more likely to feel this is a ‘must have’ feature for a new car compared to their younger counterparts (18-24, 38%; 25-34, 39%).
Around half of drivers feel heated windscreens (53%), USB charging (48%) and Bluetooth connectivity (47%) are ‘must have’ features if they were to purchase a new car.
Younger drivers in particular consider Bluetooth connectivity (18-24, 78%; 25-34, 63%) as a ‘must have’ feature they can’t do without.
Motorway lane discipline
Motorists were then asked to imagine driving on a stretch of motorway and were presented with different situations and asked which lane would they drive in.
A vast majority claim they would drive in lane 1 (81%) if the motorway was free-flowing traffic (e.g. not rush hour), one in ten (11%) say they would drive in lane 2 and a minority (2%) feel they would use lane 3.
Interestingly, when drivers are asked to imagine driving in start-stop traffic, considerably fewer feel they would drive in lane 1 (63%), and a third (32%) would use lane 2 instead. Younger drivers (18-24, 51%; 25-34, 41%) are most likely to use lane 2 if there was start-stop traffic on the motorway.
Motorists were then asked to imagine driving in four lanes with emergency areas spread every 1.5 miles. In free-flowing traffic, three in five (61%) said they would stay in lane 1, a third (34%) would drive in lane 2 and a minority would use either lane 3 (4%) or 4 (1%).
In a start-stop traffic situation, around half (48%) said they would stay in lane 1 and two in five (42%) would opt for lane 2.
Among those who said they would not use lane 1 for any of the situations described above, the risk of coming across a broken down vehicle is the most common reason why not (70%). Two in five (44%) would keep out of lane 1 to avoid unnecessary lane change manoeuvres.
One in five (20%) believe lane 1 is the ‘lorry lane’ and the same proportion just feel safer with a lane on either side of them (20%) when driving on the motorway.
May Bank Holidays
Motorists were asked about their travel plans for the May bank holidays. Around three in five drivers did not plan to drive on the May Day Bank Holiday or the Coronation (May 1st, 63%; May 5th, 59%; May 6th, 62%; May 7th, 60%; May 8th, 61%).
For those with travel plans, driving somewhere else or not completely deciding where was the most common plan (May 1st, 15%; May 5th, 18%; May 6th, 16%; May 7th, 18%; May 8th, 20%), followed by driving to visit friends or family (May 1st, 11%; May 5th, 10%; May 6th, 9%; May 7th, 9%; May 8th, 9%).
Half of motorists did not plan to celebrate the Coronation (52%), whilst 16% said they will attend or hold a private barbecue with friends/family and 9% said they will attend a local event organised to celebrate the occasion.
Driving test ambitions
Our panellists were then asked when they were taking driving lessons, whether were they aiming to pass in time for a particular seasonal or life event. Four in five (79%) had no ambition to pass by a particular event.
One in ten (10%) wanted to pass their driving test in time for a work commitment/plan and 4% wanted to do so before starting further education or before they left their childhood home.
The majority (90%) of motorists who wanted to pass their driving test in time for a particular event managed to do so.
Among the 8% who did not manage to pass their driving test in time for a particular event, three in five (59%) took between 1-6 months longer than they hoped and 22% took between 7-12 months.
Location services
We next asked drivers if they had previously used any location services apps, such as "what3words" or Google maps.
Two in three (66%) drivers have previously used a location app tool; younger drivers (18-24, 82%; 25-34, 86%) are most likely to have used one in the past whereas those aged 65+ (57%) are least likely.
14% of drivers have used a location tool to find friends at a festival/outdoor event and 13% have done so to alert others of their location. Younger motorists are more likely to have used location apps for each of these reasons (18-24, 23%, 23%; 25-34, 23%, 27%) compared to older drivers (55-64, 12%, 11%; 65+, 12%, 10%).
Vehicle tech use
Participants were then asked to what extent do they use the technology in their cars’, using a scale from 1-10, with 10 being the highest.
A third (35%) of motorists do indeed take advantage of the technology in their car (scores 8-10), men are more likely to do so than women (39% vs 26%). Again, younger drivers (18-24, 57%; 25-34, 45%) are more likely to be using technology in their car compared to their older counterparts (55-64, 35%; 65+, 32%).
A quarter (25%) of drivers do not take advantage of the technology in their car (scores 1-3); those aged 65+ (29%) are least likely to utilise this technology.
City mobility
Panellists were then asked what they thought would be the dominant vehicle for people in cities, and were given five modes of transport to choose from.
Public transport is considered to be the most dominant vehicle for people in cities with 87% of drivers selecting this mode of transport in their top two. Owned cars ranked second with 54% of motorists selecting it in their top two.
Around one in five ranked either E-bikes/scooters (23%) or ride-sharing services (21%) in their top two. E-bikes/scooters are significantly more likely to be seen as the dominant vehicle for people in cities among younger drivers (18-24, 43%; 25-34, 45%) compared to older motorists (65+, 17%).
Just 15% of drivers feel autonomous vehicles will be the dominant vehicle for people in cities, two in five (40%) ranked this mode of transport fifth.
Technology in transport
Finally our panellists were asked how they thought tech would impact how we travel in the future and were given four options to order.
Most drivers feel more real-time information would have a big impact on the future of travel; 48% ranked this first and a further 29% ranked it in second place.
Drivers are split on there being more risk to privacy and security from hackers, 23% ranked this threat as first whereas two in five (41%) ranked it as fourth. Drivers aged 18-24 are least concerned with the potential risk to privacy and security, just 12% ranked it in first place.
One in five (20%) motorists thought that more personalised options and recommendations would have the biggest impact, a further 36% of drivers ranked this in second place.
BACK TO TOP
Yonder summary March 2023
There were 13,122 responses to the AA Yonder March survey between 14 and 21 March 2023.
In this survey
- Seatbelts
- Easter
- Bad driving behaviours
- "Smart" motorways
- Future driving
- Used car buying
- Accident reactions
- Potholes
Seatbelts
We opened this month’s survey by asking drivers and AA members if there were any of the following situations in the last 12 months in which they have not worn a seatbelt for all, or part, of the journey. The majority of respondents (72%) said that this was not applicable, as they had won a seatbelt.
Of those who admitted to a situation where they had not worn a seatbelt, one in ten respondents said they had not worn a seatbelt in both a coach or minibus or when driving off road.
15% of respondents would take their seat belt off when the vehicle is moving, when they have to pay for parking/tolls.
Easter
For the next section of the survey respondents were asked if they were expecting to travel over Easter.
Saturday 8th of April was the day most people said they would be making a journey, with almost half (46%) of our member expecting to take a journey. The most popular destination on this day was to visit friends or relatives, with one in ten stating this reason. A further 15% who were travelling were as yet undecided or were travelling somewhere other than one of the options given
The second most popular day for travel was Good Friday, with 41% of respondents going somewhere, followed by Easter Sunday (39%) and Easter Monday (38%).
Bad driving behaviours
We then asked our members which, from a given list of driving behaviours, they had witnessed other drivers doing.
A staggering 93% had witnessed other drivers using their mobile phones whilst driving.
Over two-thirds (65%) of our panel had seen somone let a passenger diembark a vehicle whilst in traffic and almost half (49%) had seen someone stop to urinate on the hard shoulder of a motorway
A similar number(47%) had seen people applying makeup or brushing their hair whilst in control of a car and almost a third (32%) had witnessed someone get out of their car to confront another driver.
Shockingly,almost three in ten (29%) of our members had seen another driver reversing back the carriageway to get to a missed turning or slip road
"Smart" motorways
When asked what they think we should do to the motorway network, over half(55%) selected scrapping the "smart" motorways project and reinstating the hard shoulder. This was by far the most popular answer from the choices given.
The next most popular answer, with two in ten choosing it was to widen the existing motorways to four lanes and have a hard shoulder.
We went on to ask people how they felt when driving on various different types of motorway
The overwhelming majority of drivers(84%) felt safest on a motorway with a hard shoulder.
People felt least safe motorways without hard shoulders but with refuge areas every one and a half miles, and on motorways where the hard shoulder can be turned on and off, in equal measures(30% each).
Future driving
In the next section we explored peoples views on the future of cars in the UK. Firstly we asked if people understood the role of electric cars in the "smart grid". Nearly two-thirds(64%) of our panel were unsure about this. Next we asked if our panel if they thought car use in urban and rural areas would be different in the future. People were split on this with 45% saying they would be and slightly more(48%) saying they wouldn't.
We rounded off this section by asking if people understood the meaning of "digital roads". Again, two thirds(66%) said they were unsure about this term.
Used car buying
Respondents were asked to think back to when they last bought a used car and which checks did they carry out. Two thirds (66%) of respondents said they took it for a test drive and over half reviewed the MOT and service history documents (54%). Less than a quarter checked the oil level(25%) and respondents were least likely to check for any wear on brake pads (16%).
We then asked if they were to buy a used car tomorrow, what money-related problem would they be worried about most? The top answer was that they may have missed a mechanical problem that would be expensive to fix.
Accident reactions
Our driving panel were asked to think about a time when they have been involved in a collision and who the first person they called for help was. Over a quarter of respondents had not been in a road collision accident (27%). Of those that had, 16% were most likely to call their insurance company followed by the breakdown organisation (14%).
Potholes
We ended our March survey with two questions about the condition of UK roads. Firstly we asked our members who drive if they had experienced anything from a given list, regarding potholes.
Almost four in five (77%) respondents have had to change their road position considerably to avoid potholes.
Over two thirds said they had hit a pothole, with a further 13% having to pay out for damage caused by this
Finally we asked our members to indicate which roads they thought should see the most investment in terms of maintenance.
The order of priorities was:
- Mortorways 52%
- Major A roads 13%
- Residential roads 10%
- Fast moving rural roads 9%
- Single carriageway main roads 9%
- Dual carriageway main roads <6%
- Slow moving rural roads 2%
Yonder summary February 2023
There were 14,666 responses to the AA Yonder February survey between 16 and 24 February 2023.
In this survey
- MOT Changes
- Barriers to EV ownership
- Vehicle transitioning
- Car dependency
- ISAs
- Post pandemic behaviours
- Manual vs Auto
- Apprenticeships
MOT Changes
We began our February driver poll with some pertinent questions regarding proposed changes to the MOT testing scheme. Firstly, asking whether our members support the proposal to extend the period before a new car's first MOT test from three to four years.
Our members were generally accepting of this proposal with nearly half in support of extending the period to four years (46%). Of those opposing the idea, over a quarter (27%) were in strong opposition, whereas the same number were neither in favour nor against the idea.
When asked whether the ongoing MOT tests should be changed to every two years instead of yearly, half of our panel (50%) were strongly opposed to the idea. Just over a third (35%) were supportive of such a change, with a further 15% neither in support nor against the proposal.
Continuing on the subject of MOTs, we gave our members a selection of statements and asked whether they agreed or not. The three most agreed with statements were:
- The MOT plays a key role in keeping dangerous vehicles off the road (92%)
- With more vehicle safety technology being added to cars it is right to check/test these as part of the MOT (75%)
- I would benefit financially if the MOT changed from once a year to every two years (64%)
The least agreed with statement was "The statutory cost of the MOT test on cars should increase from £54.85 to £73.50 due to inflation".
Barriers to EV ownership
Previously, we have asked our panel what barriers would prevent them from making the switch to an electric vehicle. The initial purchase price has continued to be the main reason. This time we asked what incentives would be most likely to encourage people to move to electric car ownership.
The top incentives from the options provided were:
- A 0% interest loan over 3-5 years (16%)
- Remove VAT from new EV sales (13%)
- Re-instating the £3,500 plug in grant on new vehicles less than £35,000
However, 29% of our respondents said they would never buy an EV.
Vehicle transitioning
Continuing on the subject of EVs, we then asked our members how they felt about the coming fuel transition from petrol and diesel to EVs.
Over a third (36%) of respondents indicated they were feeling "cautious", and a further 29% were feeling "irritated" about it.
Only 7% of our panel were feeling confident about the change.
Our survey next asked people to rate, on a scale of one to ten, how likely they thought people would still own cars in 10 years' time.
Just over a quarter (26%) of the NET selections were in the middle of the scale (4-7), but the majority of selections (70%) were at the "Likely" end (8 -10).
We rounded off this section of the survey by asking our members how they plan to sell their cars in the future.The top answer, with 51% of selections was via dealerships.
Over a quarter (28%) of respondents were unsure and 14% indicated they would sell privately.
Car dependency
Next, we wanted to gauge how reliant our members were on their cars. When asked how badly they be affected by the loss of their cars, the most selected response (77%) was "I would lose the freedom of being able to visit friends and relatives whenever I choose".
In total, 96% of our panel indicated the loss of their car would negatively impact their lifestyle, with only 4% of respondents saying they would not be affected.
We went on to offer that 96% of panel members a number of statements and asked which would apply to them. Of those statements, the majority (57%) selected "it would be such an obstacle to being able to travel that i fear I would essentially become marooned in my local area".
The next most selected choice was "It would disrupt family life to such an extent that I don't think we could function in the way we need to". Over a quarter (26%) of members indicated that they would be forced to change jobs.
Individual Savings Accounts
When asked which savings products our panel were planning to use in the next 12 months, over a quarter (26%) of our members said they would be using a cash ISA.
The next most popular choice was a personal savings allowance with 17% of respondents selecting this option.
We then asked how much annually an individual can save tax-free in an Individual Savings Account (ISA). Over two in five chose the correct answer of £20,000. A third (33%) thought it was £10,000.
Post pandemic behaviours
In this section of the survey, we asked people which, if any, of the habits/behaviours they had adopted during the pandemic, they had continued with.
In all, over two-thirds (70%) of our respondents indicated that they had kept with one or more of the behaviours listed. The top answers were eating out less (37%), Driving less (31%) and visiting the pub less (25%).
30% of our members indicated none of the behaviours listed applied to them.
Manual vs Auto
With the rise in popularity of automatic gear controls in modern cars, we were interested to learn people's views on the importance of new drivers learning to drive a manually geared car.
Almost two-thirds (63%) of our members still believe it to be important to some extent, with four in ten (40%) indicating it is "very important". Only 13% considered it to be unimportant to learn to drive a manual car.
Apprenticeships
Finally, we asked our members what they thought the maximum age limit is to take on an apprenticeship.
The response was quite evenly spread across the age groups offered, with the highest number of panelists choosing 35 to 50 years age bracket.
Only 12% indicated the correct answer which is 66+
Yonder summary January 2023
There were 15, 739 responses to the AA Yonder January survey between 16 and 24 January 2023.
In this survey
- 2023 Holiday Intentions
- EV priorities
- Car insurance excess
- Winter driving
- Older drivers
- Reasons for learning to drive
- Car buying intentions
2023 Holiday Intentions
We opened this month’s survey by asking drivers and AA members what their holiday intentions are for this year. Almost a third of respondents (32%) are thinking about a trip within the UK.
Around two in five respondents (41%) state that they intend on having a holiday in the UK where they plan to drive, with men more likely than women to state this (43% vs 38% respectively).
When asked whether the cost-of-living crisis has had an impact on respondents’ holiday plans for 2023, a little over a third of respondents (34%) said they/their family are pressing ahead with their usual holiday plans.
Over a quarter (27%) of respondents said they/their family will still go on holiday this year but will scale back on what they normally do and spend
More than one in ten (12%) are holding back on holiday plans to see if financial pressures ease and will then make a decision later in the year about purchasing holidays. This figure rose to 31% in the 18–24 year-old age group.
EV priorities
In the next section of our survey, we asked our panel what they think the priority should be (from a list), to help the nation reach its electric car ambitions.
These ambitions included that all new cars in 2030 will be either fully electric or hybrid, with the latter being phased out completely in 2034. And reaching the target set by the government of having 300,000 publicly accesible charge points by 2030.
70% of respondents felt that both require equal support for the nation to switch to electric vehicles.
Almost one in five (19%) believe the priority should be to invest and install more public charge points to give confidence to future EV drivers.
Car insurance excess
The panel was then asked how much their voluntary excess is on their car insurance. For three in ten respondents, their voluntary excess is £200-£300 (30%). This was higher for respondents in London (35%).
For one in ten respondents (10%), their excess is £51-100. This was higher for those aged 65+ and those who reside in Wales (12%).
When asked, why they had set their voluntary excess at this level from a list of reasons, around a third (32%) said it was because they were in a suitable financial position to pay some excess.
Less than one in six (16%) said the excess was recommended to them by their insurer. Whilst just over one in ten (12%) said the policy was too expensive and they needed to bring the price down, this was significantly higher amongst those aged 18-24 (28%).
Winter driving
As winter produces weather that many drivers fear, respondents were asked their opinions on winter driving and whether a particular month is worse for winter weather. The majority of respondents (56%) regard the threat of bad weather to be a problem throughout the winter months.
When looking at individual months, more than a quarter of respondents (28%) think January is the worst month for winter driving whereas one in ten (12%) think February is worse.
Respondents were then asked which weather type they consider the greatest threat when driving. An overwhelming majority feel that ice is the greatest threat when driving (71%).
Older drivers
Over the next three questions, we wanted to address the sensitive subject of challenging an older friend or relative about the standards of their driving. Of those polled, 31% revealed they have spoken to an older relative/friend about whether they are still able to drive safely. This was higher for those aged 55-64 (36%) and 45-54 (35%).
We then asked those respondents who had spoken to an older relative or friend, if they had any useful third-party support when having a conversation about older driver safety. Less than four in ten (37%) of respondents felt they had received useful support, with this being significantly higher amongst 25-34 year old’s (44%).
We went on to ask those who had sought support if they thought there was enough support to enable people to have productive conversations with loved ones about when they should stop driving. Only a quarter (25%) of respondents said that they felt like there was enough support.
Reasons for learning to drive
In the next set of questions, we wanted to explore when and why our respondents who have driving licences learned to drive.
A notable majority of our panel said they were aged between 17 and 19 years old when they passed their test (62%).
Almost a third of our panel passed their test aged between 20 and 29 years of age (31%) with more women than men in this age group (37% vs 28% respectively).
We then asked our panel what their primary motivation was for learning to drive.
The top answer, with 61% was that they simply wanted to or felt it was a rite of passage. The next most popular response was for employment, with 21% selecting this reason.
Car buying intentions
We wrapped up the January survey by asking our panel some questions about their car buying intentions for 2023.
Most of our members (68%) indicated that they had a petrol or diesel car and intended to keep it.
Just over one in ten have a diesel or petrol car and intended to replace it with a used diesel or petrol car.
In total, 4% of respondents have a diesel or petrol car and planned to replace it with an electric vehicle. These were split equally between intending to buy new and used.
Lastly, we asked what their top priorities would be (from a given list) for the vehicle, if they were to buy a car this year.
The top answers were:
- Affordable enough to buy it outright (39%)
- Low running costs (31%)
- A car that will last a long time (30%)