Yonder summary December 2021
There were 13,462 responses to the AA Yonder December survey between 6th and 14th December 2021.
Buying motor insurance
We began the December survey by asking our members which, if any, add-ons they purchase when buying their motor insurance.
Over three quarters said they buy protected no claims bonus and 59% would add on legal cover. Nearly four in ten would include a courtesy car with their cover.
The survey then asked, when thinking about their motor insurance renewal quote from their current provider, what respondents (who drive) think will happen to their premium in 2020, now that General Insurance Pricing Practices rules are being introduced. 43% of members expect their premium to increase slightly.
Motorway emergency corridors
Next, we asked some questions about motorway emergency corridors on motorways without a hard shoulder. An emergency corridor is where stationary traffic parts to make a route between lanes of traffic for emergency service vehicles to travel along to get to the scene of an incident.
The most favoured point for the corridor to be formed was between lanes 1 and 2, with over a third of women selecting this option (35%) and slightly less men (29%). The 2nd choice was between lanes 3 and 4, with more men than women selecting this option.
We went on to ask how drivers should learn how ‘emergency corridors would work on UK roads. The overwhelming majority chose TV advertising as the best way to communicate the scheme (83%).
E-scooters
Our survey then asked AA members how they felt about the rise in use of e-scooters, by providing a list of statements to describe peoples potential views. The top results were:
- I think e-scooters pose a risk to pedestrians – 90%
- I believe that safety training should be mandatory before using/ operating and e-scooter – 89%
- I believe that escooters should be classified as 'vehicular ' to ensure they are registered , must be insured and riders are qualified to ride them legally – 84%
- The minimum age for using an e-scooter should be 17+ years old – 79%
EV Driving tests
In our next question, we asked our panel members what they would expect a driving lesson in an electrical vehicle to cover. The top answers, from a given list were as follows:
- Demonstrate how to charge the vehicle - 66%
- Advise on range and how to ensure you never run out of charge - 65%
- Specific advice about how to drive the vehicle efficiently - 61%
- Explain how to find charging points during journeys - 58%
- Explain jargon/acronyms - 49%
Campervans and motorhomes
Considering that during the past year, there has been a steep rise in web searches for campervans/motorhomes compared to 2020, we enquired from AA panel members why they believe the interest in campervans/motorhome has increased. The majority thought that owning a campervan/ motorhome would give more opportunities to get away (57%).
56% also responded that people think it's too much hassle to fly now.
Parking and moving traffic offences
We next asked respondents who drive, whether over the past year, they had received a ticket or fine from a council, for any of the offences from a provided list.
In total, 16% of drivers who responded had received a fine for at least one offence. Of those offences, the most common was for parking (8%). This was followed by driving in a bus lane, with 7%.
Of those people receiving fines, almost half (45%) chose the statement “I paid quickly because I accepted that I was in the wrong”. Over 1 in 10 had contacted the council to explain the circumstances and had the charge cancelled.
Changes to The Highway Code
With changes to The Highway Code imminent, we asked our panel who drive which statements from a given list they thought were true or false.
The statement most likely to be thought of as true was “Where a motor vehicle and a cyclist are on a road, travelling in the same direction and the motor vehicle intends to turn into a side road, it must give right of way to the cyclist carrying straight on before turning” (65%).
The statement least likely to be thought of as true was, “Minimum speed limits to be removed” (5%)
Festive fun
Next we asked our members who work if their employers were having any kind of Christmas parties this year. Over half(53%) said there was nothing planned and of those having a Christmas activity, the most popular was specific in- person team events (e.g. a pub lunch) with 21%.
Local road winter treatments
We finally enquired from AA panel members who drive, which, if any, of the following best describes their expectations of being able to drive during this coming winter, should there be significant ice or snowfall in their area:
- Roads between home and the nearest main road are likely to be untreated and I wouldn't use the car until they are cleared – 27%
- Roads between home and the nearest main road are likely to be untreated but I would give it a go and hope for the best – 21%
- I don't expect any problems as all the roads I use are usually cleared/gritted – 15%
- Roads between home and the nearest main road are likely to be untreated but I would have to drive because I'm expected to go to my place of work regardless of conditions – 15%
Yonder summary November 2021
There were 15,389 responses to the AA Yonder November survey between 8th and 16th November 2021.
In this survey
|
Winter driving
We began the November survey by asking our members how confident they were driving in various wintery conditions. The conditions that our panel were least confident in were snow, ice and fog. Nearly a third said icy roads, a quarter said snow and slightly less (22%) said they were uncomfortable in freezing rain. A fifth of our drivers found fog uncomfortable to drive in. Thunder and lightning, strong winds and heavy rain were the wintery conditions where over 70% of our members felt most confident.
EV driving lessons
We asked our members who already drive if they would be interested in electric vehicle driving lessons. Our panel were divided on this with 44% interested and 45% not interested. Women (48%) were more likely than men take up these lessons.
We then asked the same group: If they were learning to drive now, would they like to do so in an EV? While the largest group (39%) were neutral, neither agreeing or disagreeing, the remainder where again split, with 29% saying they would and 28% saying they wouldn’t.
Policing driving offences
Next, we asked our members to rate, on a scale of 1 to 10, where 1 was not no chance at all and 10 was a certainty, how certain they were that drivers who committed various offences from a given list would get caught and receive punishment. According to our panel, the offences where people were most likely to get caught were, driving in a bus lane (30%), speeding (26%) and driving without insurance (22%).
A fifth of our panel felt there was no chance at all being caught for careless driving (tailgating or middle lane hogging).
Christmas journeys
For the next question, we wanted to gauge peoples driving activities over the Christmas period, so we asked our members if they were planning any car journeys during the festive season.
Almost half (44%) of respondents indicated that they would be travelling by car over Christmas, with slightly more women than men expecting to do so (47% vs 43%).
The most likely busiest dates for travel were 23rd and 24th December with over half of those travelling intending to do so on these days.2022 Holiday plans
With many of the COVID restrictions lifted, we asked our panel about their holiday plans for 2022.
Nearly half (44%) of our panel were undecided whether they would holiday in 2022, or not. Of those planning to take a holiday, 15% were planning a UK destination, to which they would drive, with a further tenth having already booked.
Only 3% were planning to drive to a holiday destination in Europe.
11% of our respondents had planned a trip but were not intending to drive.
EV Drivers
Having asked our members on a number of occasions whether or not they drive an electric vehicle, we wanted to see if this number had changed and also to find out whether those that did drive an EV, would be prepared to enter into further research activities with us.
Of the small minority that do currently drive an EV, 83% said they would be happy for us to contact them further regarding this.
Used car checks
In this section of the survey, we asked our members who drive about the checks they would carry out when buying a used car.
The most popular check (from a given list of 12 options) was to take a test drive, with two thirds indicating they would do this. Checking the paintwork was the next most popular answer followed by reviewing the MoT and service history documents, with over half of respondents indicating they would do these checks. 15% of our members said they would arrange a vehicle inspection.
When we went on to ask how confident those members would be in assessing the vehicles mechanical condition, over two thirds of male respondents said they would be confident, while only a third of women said they would have the confidence to carry out the checks.
Fuel costs
We rounded off the November survey with some questions on fuel costs.
We asked whether our panel have had to cut back on other areas of spending because of the cost of petrol / diesel or made a conscious decision to travel less by car because of the cost of petrol/diesel.
A third of respondents (33%) said they had made the decision to drive less and over 1 in 10 (12%) had to cut back on other areas to help with the price increase. Of those cutting back in other areas, nearly eight in ten had reduced the frequency that the ate out, with visiting the cinema, theatre or other entertainments being the next biggest cutback.Yonder summary October 2021
There were 15,115 responses to the AA Yonder October survey between 11th and 19th October 2021.
In this survey
|
Tyre pressure maintenance
We opened the October survey with some questions about how our members maintain their tyre pressures.
Petrol station tyre inflators were the most likely option, with just over a third of our members selecting this. Nearly a quarter (23%) of drivers who responded said the rely on their vehicles Tyre Pressure Monitoring System (TPMS) to keep informed of any tyre pressure issues and a similar number chose the ‘none of the above’ option.
Emergency breakdowns
We next enquired how many times members of our driving panel had broken down. On average, AA members have experienced just over 2 breakdowns in their lifetime, with the most common reason being a flat battery.
We went on to enquire what checks, if any, our members carry out to try and avoid breaking down. Fuel levels, tyre pressures and oil levels were the top three answers.
Staying on the theme of breakdowns, we showed the panel two illustrations of possible motorway breakdown scenarios. One on a motorway with a hard shoulder and one on a “smart” motorway, in an Emergency Refuge Area (ERA). We asked the respondents to indicate where they thought they should stand, by selecting the most appropriate marked area on the illustrations.
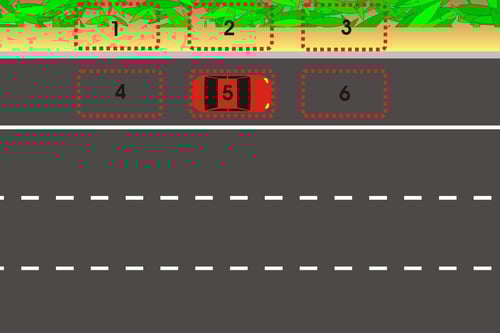
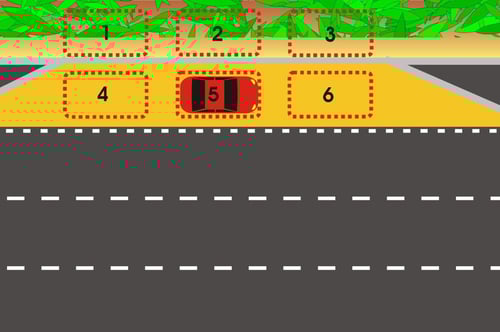
In both cases. Around four tenths of our members selected the correct zone (zone 1) with zones 2, 3, 4, 5 and 6 being chosen by decreasing numbers, in that order, in both scenarios.
Minor road collisions
We asked panel members what they would do first if they were involved in a minor collision in which no one was injured.
In 9 out of 10 responses, the first choice was ‘Get the other driver’s name and address’. Similar numbers stated they would ‘Get car insurance information’ and ‘Take photos’ (both 89%).
HGV drivers
With the shortage of HGV drivers in the UK prevalent in the news, we asked our members what they thought would encourage or discourage people into or away from the HGV industry.
The majority of respondents (93%) said ‘Better conditions when living on the one road (i.e. dedicated truck locations with living, food, washing facilities’ would act as an encourager.
Around 8 in 10 (81%) AA panel members selected ‘Improved pay (current salary range between £35-£50k per annum)’ as something that would encourage people into the HGV industry.
Highway code EV updates
In light of calls to include electric vehicle educational information in The Highway Code, we asked respondents what they think the correct use of the term kilowatt hour/ kWh is.
Nearly half of respondents (42%) selected ‘A term used to describe the amount of electricity transferred in one hour, at one thousand watts’. The second most popular choice was ‘A term used to describe an EV batteries capacity’, selected by 1 in 5 members. Both selections are correct in the context of EV’s.
EV Purchase
Taking into account the recent fuel crisis, we asked AA members if it has affected their likelihood to switch to an electric vehicle at all. 1 in 10 respondents (15%) claim they are now more likely to purchase an EV and 1% said they definitely plan to switch. Londoners (24%) are most likely to switch to an electric vehicle. However, the majority of respondents (77%) said the recent fuel issues hadn’t influenced the likelihood of them buying an EV.
Fuel shortages
Continuing on the fuel shortage theme, We asked all respondents who drive how they tracked fuel availability locally and how they responded during the recent fuel shortages.
60% of all respondents said that they had sufficient fuel in the tank to keep them driving. The remainder either reduced their driving during this period (17%) or used word of mouth/social media to judge when best to get fuel.
Flooded roads
We asked AA members, if the road ahead was completely covered by standing flood water, what are they most likely to do (from a given list). The top three things AA members would do are:
- Turn around and go another way (33%).
- Drive through only if the kerb was still visible (19%).
- Check the depth and drive through if less than 10cms deep (19%). Men (21%) were more likely to do this in comparison to women (14%).
Budget
The Autumn Budget and spending review took place on 27 October 2021. Prior to this, we asked members, from a list of transport related policies, which would they support or oppose.
The overwhelming majority of AA members (94%) would support a policy to invest more in fixing potholes on local roads with 70% strongly supporting this.
70% of our members chose to stop building ‘smart’ motorways. Support was strong across all demographics, but slightly less so among younger road users.
Road atlas
We concluded the October survey by asking our members how often they update their physical road atlas.
Members were most likely to update their road atlas book every three years (18%) or more than every five years (11%). 7% update it every year. However, over a third (36%) claim not to have a road atlas book.
Yonder summary September 2021
There were 13,467 responses to the AA Yonder September survey between 10th and 21st September 2021.
In this survey
|
Autumn driving
We began the September survey with some seasonal questions about how our members feel about driving in the autumn.
From a list of possible dislikes, over three quarters of respondents (76%) who drive selected ‘Dazzle from the sun when low in the sky’ as their primary issue. The second least popular thing about driving at this time of year was ‘Other drivers not using their lights properly’, with half of our members selecting this reason. This was closely followed by ‘inconspicuous pedestrians/cyclists’ at 49%.
EV ownership
We’re interested in how many of our panel have adopted an electric vehicle. Just over 2% confirmed that they drive an EV, a slight increase from the last time we asked the same question.
Environmental choices
We then asked AA panel members, which behaviours, from a list, they would consider doing to benefit the environment.
The top answers were:
- Switching to an EV (75%)
- Organising a litter pick (63%)
- Changing energy supplier (56%)
Road conditions
In a bit to gain insight into how people feel about the condition of the UK roads, we asked some questions about the condition of both the road surfaces and the road markings.
A large majority of respondents (87%) agreed that they feel worried about their own and other drivers’ safety because of roads being in poor condition, and over half reported that they regularly worry about their own or others’ safety.
Almost two thirds (65%) expressed some concern about the potential of damage to their vehicles from poorly maintained roads, with 1 in 10 being very concerned about this.
We went on to ask how our panel feel about road markings. While the majority of drivers (65%) who responded said that ‘road markings make it easier for me to navigate’, a slightly larger number said ‘I don’t need road markings to help position my vehicle’. A much larger proportion (82%) agreed that ‘road markings are often badly worn and difficult to read’. A similar number of drivers (78%) reported ‘other road users seem to ignore or not understand road markings’.
Cycling to work
With workers increasingly being encouraged to cycle to work we asked all AA panel members if there is adequate and secure cycle parking at their place of work to do so. Only 7% of respondents report cycling to work and having adequate and secure cycle parking.
Around half (49%) of respondents (excluding those who work permanently from home) stated their place of work does have adequate cycle parking but that they do not cycle to work.
When asked what changes would encourage them to cycle to work, almost 1 in 10 of respondents reported ‘adequate and secure cycle parking at work’ would be an encouraging factor.
Used electric vehicles
We asked AA panel members which statements, from a given set of options, applied to them regarding the purchase of a used EV.
While just over 40% selected not having any intention of buying a used EV, the next most popular options were:
- I am interested in buying a used EV but am put off by the cost of buying one (18%)
- I am interested in buying a used EV but am put off by the range before needing to recharge (14%)
- I am interested in buying a used EV but, although I don't think one would pose any difficulties for me, I am putting off the decision for a while (12%)
Road collisions
When asked who they would call first if they were involved in a collision where no one is harmed, however it caused damage to their vehicle which required being taken to a garage, over 4 in 10 would call their breakdown company first (43%). Just over a third would contact their insurance company first and 14% would contact their partner initially.
Connected car data
Next we asked all AA panel members, how willing or unwilling they would be to share the information generated by their car in each of a list of possible situations. The top selections were:
- Your car broke down. The roadside assistance provider wants to access your location and vehicle status remotely (90% willing).
- You can get an insurance price based on your miles driven (74% willing).
- Your local garage needs to access your car's diagnostic data remotely (61% willing).
Road signs
We asked all AA panel members to what extent they agree or disagree with the following statement, ‘I think the roads where I live are cluttered with unnecessary road signs’.
Almost a third (31%) of respondents agreed with this, with men significantly more likely to agree than women.
Parking habits
Finally, we wanted to know how members of our panel generally parked their cars when using their driveways or a parking bay. On driveways our panels behaviour is split with 44% reversing in, 39% driving in forwards and the remainder deciding on arrival.
When using parking bays, respondents who drive are considerably more likely to make up their minds on arrival (34%) but generally choosing to reverse in (45%) than to drive in forwards.
Yonder summary August 2021
There were 14,788 responses to the AA Yonder August survey between 10th and 17th August 2021.
In this survey |
August bank holiday travel
We began the August survey by asking whether our members were planning to drive anywhere in the UK as an outing or holiday over the bank holiday weekend. Over a third of respondents said they had no plans to travel and a further 25% indicated that they would decide last minute.
Of those who said they were travelling over the period (17%) the most popular days to travel were:
- Saturday 28 (40%)
- Friday 27 (38%)
- Sunday 29 (35%)
- Monday 30 (32%)
Plug-in hybrid distances
In this section of the survey, we wanted to gauge how far people thought a plug-in hybrid vehicle should be capable of travelling on electric power alone.
The average distance our respondents suggested was 124 miles. However, the majority (57%) of those who answered thought a PHEV should be able to travel 150 + miles. Only 4% of our members thought a PHEV would be able to travel less than 50 miles.
EV’s as tech
We asked our members to imagine electric vehicles as a piece of technology, such as a smartphone, and then to indicate how quickly they thought the tech would go out of date. Nearly a third (29%) of respondents thought the tech would last at least 3 years, with slightly less (29%) expecting a lifespan of just 1 – 2 years.
Subscriptions
In this section of the survey, we asked our members about their subscriptions (e.g. Netflix, Spotify, online shopping delivery, newspapers/ magazines, car rental). More than half of respondents indicated they had between 1 and 3 monthly subscriptions. Almost 2 in 10 said they have 4 to 6 subscriptions with a quarter saying they had none at all.
Of those with subscriptions, nearly 2 in 10 said they are paying more for them since the pandemic began (19%).
Car purchase plans
The next question was around current and future car ownership. We asked how many cars our members had, and how many they expect to have by the end of the year. Half of respondents only own 1 car, and that number is unlikely to increase. Less than 1 in 10 respondents have more than 2 cars.
We went on to ask what kind of car our members were most likely to buy, if they were to make a purchase this year. The most popular choice was a hatchback, with 35% choosing this option.
Emergency corridors
Using the below illustration, we asked our members whether they supported the use of emergency corridors and on which roads. An overwhelming majority of 71% were in favour of the concept with nearly half (48%) being strongly supportive.
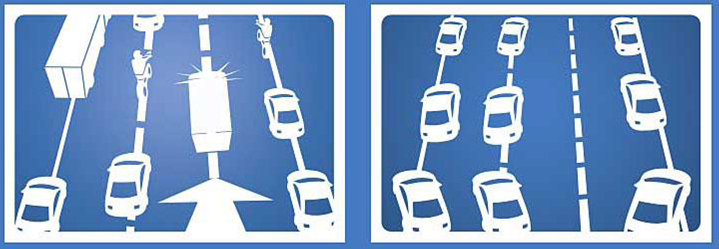
Emergency corridor example
Of those in favour of the idea, most thought it should be applied to motorways without a hard shoulder (80%) and nearly 6 in 10 (58%) thought dual carriageways with a national speed limit should also adopt the scheme.
The average time to voluntarily form an emergency corridor was 11 minutes, according to our members, with nearly half (44%) choosing between 1 and 5 minutes.
Replacing lost fuel duty
We then asked respondents what they thought would be the best way to pay for roads in the future. The following are the results for all respondents excluding those who responded, ‘Don’t know’.
The top answers from a list of options were:
- Give every driver their first 3,000 miles free and then charge a price per mile to use the road network (23%)
- Switch all fuel duty revenue onto car tax/VED so that all drivers pay a much bigger charge to access the road network (15%)
- Increase income tax by 5-7 pence to cover the costs (15%)
Vehicle damage
We asked all of our survey respondents who drive if their cars had any damage on them. While nearly 6 out of 10 of our members had no damage on their cars, the remainder had some form of damage. The most common damage includes:
- Minor bodywork damage (small dents/scratches) (37%)
- Cracked/chipped windscreen (5%)
- Dashboard warning light illuminated (3%)
Masks on public transport
Finally, we asked members, considering that the rules for wearing face masks have now been erased, whether they were as likely or less likely to wear a mask on the following types of public transport.
The overwhelming majority were more likely to wear a mask across all forms of public transport (Train 68%, Underground 70%, Bus 69%, Coach 67%).
Yonder summary July 2021
There were 14,688 responses to the AA Yonder July survey between 13th and 20th July 2021.
In this survey |
MOTs & Servicing
The July survey opened with questions on MOT extensions and how recently they had their car serviced. We asked our members if they had taken advantage of the government’s six-month MOT extension during lockdown. 79% of AA Members did not take advantage of the extension. Drivers aged 35-44 were most likely to have taken advantage of this scheme and delayed their MOT. We then asked the panel how recently they taken their car for a full or interim service. The results were mixed, however 21% had paid for a full service less than three months ago and 34% had taken their car for an interim service more than one year ago.
New driving laws
We asked respondents about the Police, Crime, Sentencing and Courts Bill 2021 as it was undergoing a Parliamentary scrutiny. In Part 5 of the bill, there were several changes to road traffic offences and their penalties, including stronger prison sentences for the worst offences. We asked members to what extent they supported or opposed a range of proposals related to this bill. Around 4% were unsure which proposals to oppose or support.
The most supported proposals were:
- Stronger penalties for those who drive whilst banned or disqualified (96%)
- Introduce a new offence called ‘Failure to stop and give particulars after accident involving actual or potential serious or fatal injury or to report accident’, with a maximum sentence of 14 years in prison (84%).
- Allow courts the discretion of issuing a driving ban rather than penalty points should the incident warrant it (83%).
- Drivers found guilty of causing a fatal incident to be immediately disqualified from driving (83%).
The most opposed proposals were:
- Introduce a new offence called “Causing death or serious injury by opening vehicle door”, with a maximum prison sentence of six months if found guilty in the magistrates’ court or two years if found guilty in the crown court (17% opposed).
- Change the definition of “Dangerous Driving” to: “where the actions of the driver involve such a breach, they would lead to a driver being failed automatically if they drove in that way during a driving test” (14% opposed).
- Drivers unable to use the ‘exception hardship' rule to avoid a driving ban upon receiving 12 points on their license (12% opposed).
We then asked the panel about the current sentence given for causing death by dangerous driving. At present, the maximum sentence for causing death by dangerous driving carries a maximum sentence of 14 years. The Police, Crime, Sentencing and Courts Bill 2021, seeks to increase the maximum sentence to life imprisonment. We asked members to what extent they support or oppose this proposal. Overall, 7 in 10 respondents (70%) support this proposal, leaving 12% opposing, 15% feeling neutral and 3% unsure.
Driving with anxiety
This section opened with asking AA members which description (from a list of 4 options) best fits their opinion when they get behind the wheel in regard to penalties and being stopped by police. Over half of members (57%) agreed they feel conscious of the penalties they could face if they drive badly.
Men (9%) were more likely to agree that the thought of penalties they could face for bad driving never crosses their mind. 8% of members agreed with this statement, which increased to 10% for those aged 65+.
18% chose they are somewhat aware of the penalties they could face for bad driving and 3% selected that they are more worried about being stopped by the police than the penalties for driving badly.
13% felt that none of these statements reflected their opinion when they get behind the wheel.
We asked all AA members who felt cautious one way or the other about penalty fines when driving, how often they had felt anxious when driving in the last 12 months. Over three quarters of members (78%) claimed they had felt anxious at some point over the last 12 months, with the remaining 22% stating they had never felt anxious.
We then asked those who had felt anxious when driving in the last 12 months, what they did to overcome this. Two thirds (67%) didn’t do anything at all and this was most common among men (72% vs 59% women).
Paying for parking
We asked the panel how they prefer to pay for their parking. They were presented with five options and asked to rank them in order of preference. The options were:
- Cash
- Chip & Pin card payment
- Contactless card / smartphone payment
- Yonder AA Executive Summary – July 2021 4
- Pay by phone via a telephone call
- Pay by app
The results were:
- Cash ranked in first place for most respondents (46%).
- Contactless card / smartphone payments were also one of the preferred options with 31% placing it first
- and 34% placing it second.
- Chip & Pin was put in first position by just 11% of respondents, but over a third of members ranked it third (35%)
- Paying by app was chosen first by 11% of AA members
- Only 1% of members chose paying by phone via a telephone call as their preferred option
EV Breakdowns
In 2020, AA attended around 13,000 electric vehicle breakdowns. We asked members what percentage of these breakdowns they thought were due to the main driving battery running out of charge. Overall, members felt around 76-80% of the breakdowns were due to the battery running out of charge.
We then asked what they thought the average range of an EV on a single charge is. Overall, members felt the range would be within the mid-range, between 151-250 miles with 26% choosing 151-200 miles and 25% choosing 201-250miles.
Used car inspections
We asked the panel when thinking about purchasing a used car, how confident would they feel purchasing a car from a dealer who is partnered with the AA as opposed to one who isn't.
Of those who would buy a used car, over a quarter (29%) would feel much more confident if the car dealer was partnered with the AA. Almost half (47%) said they would feel more confident. However almost a quarter (23%) would feel neutral about the partnership.
We then asked members who would buy a used car, if they would feel more confident or less confident purchasing a used car that had been independently inspected by the AA. The majority (87%) would feel confident, with 35% feeling much more confident and 52% feeling more confident.
The panel was then asked how likely or unlikely they would be to make a quicker decision when purchasing a used car, if it had been independently inspected by the AA. 7 in 10 (71%) agreed they would be more likely to make a quicker decision based on this. Over a quarter (26%) felt it wouldn’t make a difference how quickly they would purchase a car, which increased to 44% among those aged 18-24s. Only 1% said it would make them unlikely to purchase the car any quicker.
What I keep in my car
In the final section this month, we asked AA members which items they always keep in their car (from a given list). Around 1% of members do not keep anything in their car. The most kept items in the car by over half of members were:
- Car Jack (72%)
- Spare tyre (71%)
- Car manual (62%)
- Sunglasses (60%)
- Mobile phone charger (54%)
- First aid kit (53%)
The least likely items people always keep in their car were:
- Portable battery pack (5%)
- MOT certificate (6%)
- Insurance certificate (6%)
- Empty fuel can (7%)
- Snacks (9%)
Additionally, we asked members which items they have left in their car for weeks or months at a time. The most likely items to be left were pens (63%) with men (66%) being more likely than women (58%) to leave these in their car. This was followed by CDs.
A quarter (24%) agreed they had left travel sweets in their car. Meanwhile spare clothes and shoes (18%) were low down on the list, One in ten (13%) said they have never left anything in their car for weeks or months at a time.
Yonder summary June 2021
There were 14,719 responses to the AA Yonder June survey between 8 and 16 June 2021.
In this survey |
Bank Holiday getaways
Our June survey opened with some questions about the late May bank holiday. Starting on maintenance, we asked if our members used the holiday to do any work on their cars. Over a quarter indicated they carried out some minor maintenance with 15% using the time to carry out basic vehicle checks. 7% said they’d cleaned their cars and 5% had visited their garage.
We then asked if our panel had travelled during the holiday/half term period. Almost half indicated that they had made a trip and most of these travelled by car. The most likely people to travel over this period were 18-24 year olds.
The AA
We wanted to gauge how our respondents feel about the AA by associating words from a list with the company. The top responses were:
- Reliable (92%)
- Trustworthy (90%)
- Motoring experts (90%)
- Reassuring (89%)
- Friendly (85%)
Following on from this, we presented members with 20 areas the AA could play apart in and asked which our members thought the AA should be involved with. The top responses were:
- Vehicle breakdown (87%)
- Driving advice (72%)
- Road safety campaigns (i.e. tackling drink driving) (68%)
- Vehicle safety (i.e. better in-vehicle technology) (63%)
- Vehicle insurance (62%)
The three lowest rated options were cycling, home insurance and financial services.
Insurance changes
In our next question, we asked if our members had declared any changes to their insurance policies as a result of the pandemic. The majority of those who responded said they hadn’t declared any changes. Where people had informed their insurance companies of change, the top answer was to declare a reduction in vehicle mileage (20%)
Post pandemic travel
In an effort to discover more about post pandemic use of public transport, we gave our panel a list of statements and asked which they most agreed with. While most agreed with the statement was ” Before coronavirus, I did not travel by public transport (bus/ train/tram/underground) regularly and I don't expect to start using it regularly after 21 June”, more than 1 in 10 respondents indicated that “Before coronavirus, I used to travel by public transport (bus/ train/tram/underground) regularly, but I don't expect to go back to using it regularly after 21 June”.
We followed this by asking if travellers would expect to have to wear face masks on public transport after 21 June. The vast majority (84%) indicated that they did expect to, with 70% saying that even if restrictions were lifted, they would continue to wear one.
EV purchase incentives
We have asked about barriers to purchasing an EV in previous surveys and high purchase price has regularly been the main reason for our members not to take the step. This month we gave our panellist’s a selection of measures that might influence their decision to move into an EV. The most influential were:
- Remove VAT on the purchase of an EV car (including PCP deals etc) (66%)
- Increasing the number of rapid charging connectors (80% charge within 30 minutes) from 10,400 to over 25,000 (64%)
- A scrappage scheme like the Government sponsored scheme in 2008 (57%)
- Free parking to all EVs in all council owned car parks (49%)
- Remove VAT on leasing costs for EVs (47%)
Driving skills
We gave our panel members a list of driving test skills and ask what they would find hardest to do if they were to re-take their driving test. While over half of respondents (55%) were confident that they wouldn’t find any of the listed skills difficult, 21% drivers listed parallel parking as potentially challenging, and 1 in 10 would struggle to reverse around a corner.
UK Holiday destinations
When asked about their holiday plans and whether they intended to visit any UK destinations this year, a quarter of our panel said they didn’t intend to go on holiday at all. I in 10 were planning to go to a seaside resort that was not on our list, with similar numbers Wales and Cornwall. The next most popular destinations were Devon and the Lake District.
Green number plates
We asked our survey respondents about the green sections appearing on UK number plates and if they knew what this indicated. Most of our panel (63%) recognised that this kind of marking indicated a zero emission vehicle. However, almost a third (31%) didn’t understand the meaning of the sections.
Catalytic converter crime
Finally, we wanted to know if our members had any worries about or experience of catalytic converter crime. Over a third indicated that they were worried about the crime, but hadn’t taken steps to prevent it. 1 in 5 had taken some basic steps like parking in a garage. I in 10 surveyed said they know someone who has had the catalytic converter stolen, with this number doubling (21%) for those living in London. Only 1% said that they ‘have taken major precautions to prevent their catalytic converter from being stolen’ such as having an anti-theft device fitted, having their catalytic converted security marked etc.
Yonder summary May 2021
There were 15,746 responses to the AA Yonder May survey between 10 and 18 May 2021.
In this survey |
Driving in 2021
We opened our May survey by enquiring whether our members thought they were likely to drive more in the remainder of 2021 than in 2020 and also in comparison to their pre-pandemic mileage. 44% said they expect to drive more in the remainder of the year. In response to the second part of the question, only 1 in 10 expect to drive more compared with nearly half expecting to drive less than in pre-pandemic times.
Future working patterns
In our next question we asked panel members how they used to work before the pandemic, how they worked during the pandemic, and how they expect to work when the restrictions are lifted. Three quarters of those to whom the question applied said they used to work at a physical place of work full time, with less than 1 in 10 working from home full time prior to the pandemic.
During the pandemic the number of people attending work at a physical workplace dropped to just over a third (34%), and slightly more than this (35%) said they were working from home. 12% of our members who worked prior to the pandemic said they had been furloughed.
Holidays in 2021
With the restrictions lifting, it is anticipated that many people who have a holiday in 2021 will do so in the UK. Therefore, we asked AA panel members what, if anything, they think hotspots should do to maintain pandemic restrictions while also enticing visitors. The top responses were:
- Cheaper rail fares to reduce road traffic: 43%
- More Park & Ride sites to reduce vehicle traffic into destinations: 42%
- Free parking for suitable period (i.e. one hour): 40%
- Discounted public transport: 32%
We also asked panel members their likelihood to take certain types of holidays this year. The top responses were as follows:
- Hotel: 50%
- Professional holiday lettings (i.e. Holiday Cottages): 43%
- B&B: 28%
- Short-term private rent (i.e. AirBnB): 23%
- Static Caravan: 17%
- Camping: 13%
Buying an EV
The next question in the survey asked panel members their opinion on what car dealers could do to make the process of buying an electric vehicle easier. Advice on range and how to ensure you never run out of charge was the top response, chosen by nearly half of panel members (49%). Women (52%) were more likely than men (48%) to think this advice would make the EV buying process easier.
44% of panelists believed that advice on the charging kit needed at home and how to buy it would make the process of buying an EV easier.
37% of panel members said that an explanation from car dealers on how to claim Government incentives for EV buyers would be helpful. Men (38%) were more likely than women (35%) to think this would make the process easier.
Car insurance & EVs
Panel members were then asked which factors they considered important when choosing a vehicle insurer. Close to 2 in 5 (39%) said that picking a brand/company they know and trust was important, a third (33%) said that getting the cheapest price was a key factor, and 11% said they considered good independent ratings/reviews important.
Windscreens
Panel members were next asked whether they had had any glass on their car repaired or replaced on in the last 12 months, including the side windows and the front and rear windscreens. While the majority (94%) said they had not, 6% reported that they had some glass on their car repaired or replaced. We asked those who’d had glass repaired or replaced how they’d gone about it. The majority (58%) said they’d goner through their insurer, with a further third (31%) said they’d used a specialist windscreen company.
Changes to The Highway Code and the Driving test
With this year being the 90th anniversary of the Highway Code, we asked AA panel members what changes, if any, they thought should be made to the Highway Code. Almost two thirds (64%) said there should be more information on smart motorways. Over half (56%) believe The Highway Code should include information about EV’s and a similar number (54%) think more information about how to behave around vulnerable road users should be included.
We also asked respondents what changes they think should be made to the driving tests this year. The top response was that driving tests should introduce a minimum learning period before learners can book tests, chosen by over 2 in 5 panelists (44%).
Young person safety
The survey next asked AA panel members what they think is the greatest risk to the safety of teenagers. The top four risks chosen by respondents included drugs (39%), gun and knife crime (25%), driving (14%), and drinking (14%). However, gun and knife crime was more likely to be considered the greatest danger to teenagers by women (27%, versus 24% of men) as well as younger respondents aged 18-24 (37%), 25-34 (30%), and 35-44 (30%) compared to older respondents.
Roads policing
To round off the May 2021 survey we gave panel members a list of road offences and asked them how likely or unlikely they thought it was that a driver committing each of the offences in the area where they lived would be caught and punished. The results are as follows:
- Speeding 27%
- Driving in a bus lane 27%
- Drink driving 21%
- Driving without insurance 18%
- Driving whilst using a handheld mobile phone 16%
Yonder summary April 2021
There were 17,039 responses to the AA Yonder April survey between 13 and 20 April 2021.
In this survey |
Pre journey checks
We began the April motoring survey by asking our members who drive, which preparations they make before taking a long car journey (20+ miles). The majority (81%) said they would fill up with fuel. The next most popular answers were to check tyre pressures (65%), checking the windscreen washer fluid and checking the oil, with half of respondents claiming to do this.
UK Holiday plans
When asked about their plans for holidays in the coming months, 4 out of 10 of our members said they would be taking a “staycation” this year, with most of them choosing to drive to this. Over a third of respondents had yet to decide on their holiday for 2021.
Property browsing
The pandemic has led to many people re-evaluating their homes. With this in mind, we asked our panel how often they looked at properties online, using websites like Zoopla or Rightmove, with no intention of moving. Over half of respondents admitted to doing this, with women and younger people more likely to do this.
The primary reason given for looking at online properties was to investigate house prices, with over half of our members citing this. Just over 2 in 10 people said they look at other properties for inspiration for their own home and garden.
Road safety confidence
We asked our survey what types of road they felt safest on, using a sliding scale where 0 was very dangerous and 10 was perfectly safe. Dual carriageways are where our members who drive feel safest, followed by motorways. Men are more likely to feel safe on motorways than women. Our panel feels less safe on rural and urban roads, but overall our members feel pretty safe on the UK road network.
Driving test confidence
Next, we asked our members who drive how confident they would feel about passing their practical and theory driving tests, should they have to retake them now. Confidence in passing the practical test was considerably higher than the theory, with 80% of respondents feeling they would pass their practical, versus 57% for the theory. Unsurprisingly, younger members were more confident in passing their theory test than older respondents.
Driving conditions
We described a number of different driving situations to our panel and asked if they had encountered any of them. Most of our respondents who drive had experienced all of the conditions listed, with the most likely being driving near cyclists, horses or pedestrians. Driving on rural roads was the second highest scenario with 87% saying they had done this. The least likely was driving with new road layouts/furniture, but this was still chosen by 61% of our panel.
AA Services
Our panel were asked to choose between two statements relating to the AA and our products and services. The first statement indicates the respondent is only interested in breakdown related services, the second indicates interest in all of the AA’s products and services. Our respondents were split on this, with breakdown related services receiving just over half of the votes (52%).
Car purchase plans
In our next question, we asked our panel if they were planning on buying a car in the next 12 months. While the majority have no plans to replace their cars, 28% of those who said they were planning a purchase wished to do so for environmental reasons. The second biggest factor was that their old car was in need of expensive repairs, followed by being bored with their current vehicle.
Vehicle standards
Moving on to vehicle type approval standards, we gave our panel a list of safety features and asked them to choose which, if any, they would like to see introduced as standard on new cars in the UK. The top 3 features were rear seat belt warning systems (65%), automated emergency braking (53%) and driver fatigue detection systems (47%). Alcolocks received the least votes, but almost a third of respondents (29%) still thought these should be introduced.
Easter Travel
Finally, we asked what our members did over the Easter break. The majority of AA members said that they didn’t travel over the Easter weekend (75%). Of those who did travel, only 24% said that they did so by car.
Of those that didn’t travel, half said they had not had any plans to go anywhere while a further third stated that Coronavirus concerns were behind their reasons not to travel that weekend.
Yonder summary March 2021
There were 15,549 responses from AA members to our online poll between 9 and 17 March 2021.
In this survey |
Effect of COVID on vehicle needs
We opened the March survey by asking our members how the pandemic has impacted them and their household in relation to the vehicles they own. An overwhelming 75% of respondent’s vehicle needs have not changed during the pandemic.
Only 12% of respondents have needed their vehicle more than ever, whilst 6% agree that sharing a car with another member of their household is now a practical option.
These views remain consistent among different genders, age, and region.
Vehicle affordability
We gave our panel a list of life events and asked them when purchasing a car (regardless of purchase method), how these life events would concern them in affecting their ability to pay for the car. 20% of respondents agree that being made redundant would cause them to be extremely/very concerned when thinking about their ability to purchase a car. This view was shared more among younger members (56% 18-24s vs 22% 55-64).
Redundancy proved to be the most concerning life event, followed by illness (15%) and death of a partner/spouse (14%).
56% felt that moving house would cause them to be slightly/ not concerned when it came to thinking about their ability to purchase a car.
Roadside meadows
To support wildlife and pollinators (i.e. bees), councils are being encouraged by environmental charities to consider leaving grass verges uncut for longer, or plant wildflowers to grow “roadside meadows”. Given this information we asked our panel members to what extent they agree with certain statements on this issue.
85% overall agree that they would like to see more grass verges converted to roadside meadows so long as it does not impede visibility at junctions. Whilst 81% overall agree that they would like verges to be a mix of grass and flower/wildflower
Just under half of respondents (43%) disagree that grass verges should be cut back at more regular intervals
61% overall disagree that roadside meadows would be distracting to drivers.
Commuting
We asked individuals on our panel who travel more than 10 miles each way to work in major towns or cities every day, which type of transport they use for the main part of their journey. The most popular mode of transport was a petrol car (44%) followed by a diesel car (39%) and the train (7%).
Petrol car was the most popular mode of transport for women (60% vs 38% men) however a diesel car was more popular among men (43% vs 29% women).
The least popular modes of transport were Bicycle (1%), electric car (1%), plug – in Hybrid car (1%) and LPG cars (1%).
We then asked members on the panel who travel more than 10 miles each way to work in a major town or city every day the main reason why they do this every day. The two most popular reasons were that they got the job and simply accepted that getting there would entail a long drive (38%) and that a bit of driving every day is a small price to pay to be able to live where they do (28%).
Smart motorway concerns
Motorways are the UK's busiest roads and are often congested. ‘Smart’ motorways were designed to help resolve the problem by providing additional capacity, predominantly through turning the hard shoulder into a running lane. Emergency zones were built at varying intervals to provide a relative place of safety. Given this information we asked our panel what they think should happen to the motorway network. 56% agreed that they should scrap the “smart” motorways project and reinstate the hard shoulder, 17% agreed that they should widen the motorway network so there are four running lanes and a permanent hard shoulder and 1 in 10 (10%) agreed that they should build “smart” motorways where the hard shoulder is only used when the motorway is busy.
We then asked members on the panel that drive how safe they feel driving in different scenarios. The scenarios that people overall felt the most nervous/anxious about, given a set list of scenarios were:
- A motorway where the hard shoulder can be “switched on and off” so it can be used as a running lane at peak times (39%)
- A motorway with no hard shoulder but with emergency refuge areas (lay-bys) about one and a half (1.5) miles apart (39%)
- A motorway with no hard shoulder but with emergency refuge areas (lay-bys) about one (1.0) mile apart 36%)
Easter travel
Easter was in early April this year, with Good Friday on 2nd April, Easter Sunday on 4th April and Easter Monday on 5th April 2021. Given this information we asked the panel whether they expected to be driving on any day over easter and if so why.
Around 3 in 10 members expected to drive on either one of those days. However more people were expecting to drive on Saturday (3rd April) compared to any other day (36%).
Among those who expected to drive, the most popular reason (on the list given) for driving was to visit friends or relatives and the least popular reasons for driving was simply driving to a town or city for leisure and driving to a sports event.
Many members would not have driven at all on these days
- Good Friday (69%)
- Saturday 3rd April (64%)
- Easter Sunday (70%)
- Easter Monday (72%)
Post lockdown journeys
We asked our panel to think about any planned or potential UK travels they may take this year following the recent government announcements. We then asked them where they are most looking forward to going, from a given list, when restrictions lift in their area. The top answers were:
- Visiting friends and family (45%)
- Going on a staycation or night away from home (14%)
- Going to a pub or restaurant (11%)
- General outdoor leisure (8%)
EV awareness
Our next few questions aimed to understand the awareness and attitudes around electric cars. We first asked our panel how familiar/unfamiliar they were with different schemes/incentives that are in place for the purchase and use of new or used electric cars. Out of a given list, the schemes/incentives that most people felt they confidently knew of/about were reduced vehicle excise duty (car tax) (37%) and electric cars can be exempt from congestion charging and parking charges in some areas (28%).
The schemes/incentives that most people had never heard of were lower benefit-in-kind for company car drivers (69%) and salary sacrifice scheme (69%)
We then went on to asking about the extent of their agreement with statements about the attitudes and beliefs around electric cars. Just over four fifths (81%) overall agree that electric cars are too expensive, 77% of respondents believed that an electric car would not take them as far on a single charge as a petrol or diesel car would on a full tank of fuel and 59% overall agree that charging an electric car takes too long. These were also the top agreed upon statements.
68% of respondents overall disagreed that there were enough charging points across the UK.
Finally, on this subject, we asked members on the panel, what would give them more confidence in owning an electric car. 75% of respondents admitted that ease of access to a charging point at home would overall give them more confidence and 73% of respondents acknowledged that if they knew that they could get a charge at any charging point irrespective of who operates it or who supplies the electricity this would also give them more confidence. Interestingly, 13% of members said having the opportunity to drive one would give them less confidence.
Autonomous vehicles
We asked members about fully autonomous vehicles (one which can drive without any input from a human in all conditions):
72% agreed even if they knew it was statistically safe, they don't think they would feel at ease riding in an autonomous vehicle. This figure was higher among women (76%).
34% agreed insurance premiums for autonomous vehicles would be higher than for conventional vehicles.
29% agreed they think advances in science and engineering will allow autonomous vehicles to be safer than human drivers.
Half of members (50%) disagreed that by 2025, autonomous vehicles will be widely available.
We lastly asked our members about a purely hypothetical situations as follows:
Situation 1
Imagine that two children suddenly run into the road in front of an autonomous vehicle carrying a single ‘passenger’ and travelling too fast to stop in time. The vehicle has three basic options each of which is likely to result in at least one fatality, but which should it choose?
- 61% said swerve right into the back of a parked HGV.
- 5% said continue straight on, running the children over.
- 2% said swerve left to run into an elderly couple walking on the pavement.
Situation 2
Imagine now that YOU are riding as the sole ‘passenger’ in an autonomous vehicle. Two children suddenly run into the road in front of the vehicle, but it is travelling too fast to stop in time. Which of the following choices would you want the autonomous vehicle to make?
- 63% said swerve right into the back of a parked HGV.
- 5% said continue straight on, running the children over.
- 2% said swerve left to run into an elderly couple walking on the pavement.
Yonder summary February 2021
There were 18,969 responses to the February 2021 survey between 9 and 15 February 2021.
In this survey |
Buying used cars in lockdown
We opened the February survey by asking if our members would buy, or had considered buying a used car during lockdown without seeing it in person. The overwhelming majority of respondents were against this idea with over 90% saying they wouldn’t consider it.
The things that people said would increase the likelihood of them considering purchasing a car in this way were having the vehicle inspected by a trusted organisation, not being charged to return the vehicle if they changed their mind and knowing the dealer was associated with a trusted body.
Career changes
When we asked our panel if they had considered changing their career in the last six months, a quarter of those who work said they had, with those on lower incomes or younger respondents more likely to say this.
Covid car cleaning
With COVID–19 making people more aware of the importance of cleaning frequently-touched surfaces, we asked if people's car cleaning habits had also been affected. 37% of respondents indicated they were cleaning the car steering wheel more frequently. Other areas getting more attention were the interior and exterior door handles and the gear stick.
Rear daytime lights
AA panel members were then asked their opinion on whether it should be a legal requirement for new vehicles to have Daytime Running Lights (DRLs) at the rear as well as the front of the vehicle. 71% were in agreement that this should be a legal prerequisite, while 15% didn’t believe it was necessary and another 15% were on the fence.
Drink-driving prevention
We asked our panel to choose, from a list of options, what measures they would support to tackle drink-driving on UK roads. The top three chosen were:
- Introduce a zero-tolerance policy across the UK (49%)
- Introduce random testing by the police (46%)
- Reduce the limit in England, Wales, and Northern Ireland to match Scotland (45%)
Driving in lockdown
The next question in the poll asked AA panel members whether they had experienced any unexpected benefits of driving because of the UK lockdowns. A notable 92% of respondents admitted that there had been advantages to driving during lockdown, and that they had experienced some sort of benefit. Of the respondents who believed there were benefits, quieter roads and spending less money on fuel emerged at the top, chosen by 80% and 79% of these panel members respectively.
Smart motorways
We asked the members of our panel who drive if they had experienced driving on motorways with All Lane Running (ALR) sections. 60% said they had with males more likely to indicate this.
We then asked which safety measures, from a given list, should be implemented the fastest. The top answers were:
- Retrofitting more emergency zones so that the maximum distance between them is 0.75 miles (47%)
- Retrofitting a stopped vehicle detection radar system to help identify vehicles stopped in a live lane (36%)
- Issue a £100 fine and 3 points for drivers who drive in a lane with a red ‘X’ showing (31%)
- A public safety and awareness campaign (28%)
Cash saved in Covid
The next question aimed to understand saving habits during Covid, and asked respondents whether they had saved more money since the lockdown began, than they would have if Covid had not happened. Over half (57%) admit having saved more than they would have, while 1 in 4 (25%) believe they saved roughly the same as expected. 13% claim to have saved less than expected pre-Covid.
Fly tipping
With more people getting out and about in rural locations, we asked if our members had noticed an increase in rubbish dumped at the roadside. Just under half our respondents indicated they had noticed an increase, rising to just over half in Yorkshire and Humberside.
Escaping in Covid
Given that people have been stuck indoors since lockdown began, we asked our panel members how they manage to give themselves space away from other members of their household. Amongst those panellists to whom this question was applicable, almost two thirds (64%) admitted to spending more time in the garden, while one-in-five claimed to spend more time in the garage (21%) and find an excuse to go on a drive (20%), respectively.
Home schooling
We then asked those respondents with school-age children in their households to give us their opinions on home-schooling.
79% of our panellists believed that not going to school was damaging their child’s social development, 73% believed that it was damaging their academic development, while 64% believed that it was detrimental to their child’s physical development.
Home-schooling, however, has led to having an increased respect for teachers, in more than 2 in 5 respondents (43%).
Yonder summary January 2021
There were 17,373 responses to the January 2021 survey between 12 and 20 January 2021.
In this survey |
EV Ownership
We began our first survey of 2021 by asking our members a few questions about plug-in hybrid/electric vehicle ownership.
Of all respondents, 5% said they had owned or driven some form of plug in vehicle. We followed this with some questions about charging those vehicles. The top issues given, from a set list were:
- Too many apps required (30%)
- The price of charging at public points is unclear and confusing (27%)
- I would use my EV more if public charging was easier (26%)
When we asked what improvements would make it easier to use public charge points, all of the options were overwhelmingly supported. The ability to find public charge points from the cars navigation system, and access to real time data on all charge points (e.g. knowing in advance if they are in service or available) were most popular, both getting 88% agreement.
Finally on this subject, we asked what our driving members considered to be the top three preferred methods of payment for public vehicle charging. The top three were contactless credit/debit card, chip and pin card and via a single app.
Road conditions
We asked our panel a number of questions relating to road conditions. Firstly, we wanted to know how people felt about the road surfaces in the areas they live. On a scale of 0 to 10 where 0 is terrible and 10 is excellent, the majority of people indicated a score of 4 – 7 for residential, main and trunk roads. Motorways scored higher with almost half (49%) rating them 8 – 10. We followed this up with a similar question about road markings. again using a scale of 0 to 10. Similarly most people rated local main roads 4 – 7, with the exception of motorways where 55% of people rated them 8 – 10.
When we asked our members to rate levels of congestion in their areas using the same scale, the spread was more even with all road types receiving the most votes in the 4 – 7 range.
We rounded off this section by asking how important our member felt it was to improve and resolve the road condition issues in their area. Every sector of our panel felt this was important.
Protected no claims bonus (PNCB)
When asked if they had a protected no claims bonus on their car insurance policy, 8 out of 10 respondents said they had, except in our younger category where just under a third (32%) indicated they had one.
Of all of those polled who drive, 71% indicated that a PNCB was a benefit worth paying extra for and 70% said they wouldn’t expect a rise in insurance premiums after a claim, where they had a PNCB.
The AA Yonder survey
We rounded off our first survey of 2021 with some questions about the survey itself.
24% of our respondents said they complete the survey every month and 40% complete it whenever they see the email.
The main motivation for completing the survey is the £500 prise draw. However, 50% of respondents said they want to express their views on the subjects covered in the survey, 37% said they’re interested in the motoring issues and use the survey to keep informed.
When asked how well or badly the survey does at a given set of options, the majority (76%) said it does well at representing the views of road users and all of the other options received an overwhelmingly positive response.
Finally, we asked our respondents what we could do to improve the survey. As well as set options, we gave our panel the opportunity to add their own suggestions for this question.
Almost half of respondents wanted more feedback from the previous surveys and over a third asked for more incentives. A quarter would like the ability to suggest questions.
Some of the top verbatim suggestions included:
- More free text feedback options
- More attention to rural areas
- Changing the survey colour scheme
- More about motorcycles/motorcyclists
- Increase prize money/more prizes


