Yonder summary December 2020
There were 12,977 responses to the December 2020 survey between 8 and 14 December 2020.
Car ownership costs
We opened the December AA Yonder survey with a few questions about people’s cars and the costs involved in owning and running them.
The average age of vehicle among our panellist was 12 years and the majority of those who responded said that they had purchased their car as a used vehicle and had paid for it outright at the time of purchase (56%).
1 in 10 bought their cars new and this was most likely to be drivers over the age of 65, rising to over a quarter in that age group.
We then asked how much people had paid for their cars. 1 in 10 indicated their cars had cost up to £5K but the average price paid across all respondents was just over £12.5K. Again, older drivers were likely to pay more for their vehicles.
When we inquired about annual vehicle ownership costs, over a quarter of our survey panel were unsure how much they were paying. Of those who offered an estimate, the average spend was £1890 per year (£157 per month).
We then asked respondents to go into more detail based on a list of common motoring expenses. The resulting figures showed that motorists generally under estimate the cost of motoring by more than half. Most of our panel felt this was acceptable, although almost a third felt the cost was more than expected.
1 in 5 of our panel indicated that they were actively seeking to reduce motoring costs, although only 11% were looking to change their car to achieve this.
Replacement car plans
Moving on from cost’s, we asked our members about changing their cars, both historically and their future plans. In the past, the main reason for replacing cars (from a list of options) for our panel was because the vehicle had become unreliable. The next most popular reason was because they wanted to upgrade their car (37%).
We rounded off this section with some questions about the importance of a range of factors, from a list, that would influence drivers when choosing their next car. The top reasons included:
- Low cost of ownership
- Keeping the initial purchase cost as low as possible
- Being able to keep the same car for more than 5 years
- No mileage restriction
59% of drivers said low emissions/electric was an important consideration.
Use of headlights
We asked our members who drive about their use of headlights and high beams on a variety of roads. The vast majority (91%) switch between full and dipped beam on minor country roads, with three quarters of drivers tending to stay on dipped beam in on busy or built up areas.
Our panel were more divided when talking about their use of headlights on motorways, with around half saying they switch between main and dipped beam and the other half remaining on dipped beam on these types of road.
UK Road trips
When we asked our members to think about the most important aspects of any planned or potential road trips they may take in the UK in 2021. A quarter of those who took part in the survey said that spending time with family and friends would be the most important part of any trip.
Male respondents felt that having the freedom to go where they want was the most important thing.
2030 ICE vehicle sales ban
We asked our panel what they thought the mix of vehicle drive types would be by the beginning of 2030. On average, respondents estimated that 30% of vehicles in 2030 will be petrol and that 17% would be diesel. Across the electric vehicle types, AA members think a fifth (20%) of vehicles will be battery electric, 14% will be regenerative hybrid and 12% will be plug-in hybrid whereas hydrogen fuel vehicles are estimated to make up only 5%.
New Year’s driving resolution
Of those drivers who said they make New Year’s resolutions, the most popular was to walk more, with a third of respondents choosing this option. This was followed by driving more economically, driving less often and 1 in 10 said they wanted to cycle more.
Driving offences
When we asked our panel members who drive if they’ve been pulled over by the police whilst driving a car or riding a motorcycle, reassuringly only 3% said that they had. Of those that had, a quarter said there was no obvious reason for being stopped.
2021 Holiday plans
To end the December 2020 survey, we asked AA members about their holiday plans for 2021. Over half (54%) are waiting to see if the pandemic restrictions are lifted before deciding on holiday plans and 14% don’t plan on going on holiday at all.
One in ten (11%) plan to book a UK trip for 2021 and the same proportion (11%) claim to have already booked a UK trip. When it comes to overseas holidays, fewer respondents claimed to have booked (10%) or plan to book (8%) this type of trip.
November 2020
There were 16,486 responses to the November 2020 survey between 10 and 16 October 2020.
Flood water
When we asked our AA panellists what they would do if they came across flood water while driving, less than a third (31%) said they would turn around and find another route. Female drivers were more likely to choose this option.
1 in 5 respondents said they would drive through if the kerbs were visible. Overall, men were considerably more likely to choose to find a way through the water than women.
Mobile phones while driving
When asked whether they had used their mobile phones in any capacity while driving, only 10% admitted that they had. This was more likely to be the response from younger drivers. The most common use of mobile phones was texting whilst sat in traffic (7%)
We asked if people had used their phones whilst in a holder or cradle whilst driving, 29% had done so and the vast majority of those had used it as a Sat-Nav.
Christmas getaway
When we asked our members if they were planning any journeys over the festive period, around a quarter said they were and almost a third were undecided. Of those with travel plans, the most popular day to travel was Christmas Eve with 48% choosing to travel on this day. This was followed by Friday 18 December with 46%.
The most popular day chosen to travel for shopping was Saturday 19 December with 1 in 5 respondents choosing this option. For those travelling to visit friends or family, Christmas day was the favourite option with 35%
Car crime
Only 3% of our panel indicated that they have experienced car crime in the last 12 months. Of those who had, almost a third of crimes were theft from the boot or cabin and 1 in 5 had experienced theft of car parts or bodywork.
Christmas shopping
We asked our panel to what extent their pre-Christmas preparations might change in the light of the Coronavirus pandemic. More than half (57%) intended to change their plans to avoid crowds. Female and younger respondents were more likely to do this.
Two thirds of those who expressed an opinion suggested they were expecting to do their shopping online.
Festive drinks
In our next question, we wanted to gauge people’s social activity should the pubs and restaurants re-open at the end of the second lockdown (2 December). Almost a quarter of respondents said they would walk to their local pub/restaurant, with a similar number opting not to visit anyone outside of their household.
More than half (52%) said they would be buying their own food and drink to enjoy at home.
Christmas movies
We offered our panel a list of Christmas films and asked them to choose their favourite. 59% of respondents indicated that they had a favourite film and the top three from the list each received 13% of the overall vote. They were:
- A Christmas Carol
- It’s a Wonderful Life
- Love Actually
Of our panellists in the age group 25 to 34 years, 90% indicated they had a favourite film and for this group, Home Alone came out on top with almost a quarter of the votes. Elf did best in our 18 to 24 year-old group with 1 in 5 choosing this film.
EV Ownership
While only a small percentage of our members who took part in the November survey are EV owners, more than half of them indicated that they had experienced issues with charging their vehicles.
The top issues were finding the charge post out of order and finding a petrol or diesel engine vehicle had parked in the EV charging location. 42% of those who had an issue said they had received a free charge from a public charger.
Insurance auto-renewal
When asked about auto-renewal of insurance, 80% of our panel indicated that it should be an opt-in choice. Almost a quarter of those who responded said they thought it should be outlawed altogether.
Memory lapses
When we asked our driving members if they had experienced the feeling where they couldn’t recall the last few moments of their journey, 14% said they had and this was more likely in the younger age groups from 18 to 24 and 24 to 34 years.
Icy windscreens
Finally, we asked our drivers what methods they preferred to use when de-icing their cars. The top choice with 72% was an ice scraper, followed by a de-icing spray and 44% said they sit in the car while it warms up.
October 2020
There were 16, 201 responses to the October 2020 survey between 13 and 19 October 2020.
EV Ownership
In a repeat of a question from February’s survey, we asked our panel if they would consider buying an electric car when they next changed cars. There was a slight increase from the previous survey with 49% saying they would (+2%). Londoners and younger drivers were most likely to say they would consider this.
Of those who said they wouldn’t consider buying electric, the top reasons cited were:
- EV’s are too expensive (87%) down 2% from Feb 2020
- Charging an EV takes too long (70%) down 2% from Feb 2020
- The national grid wont be able to cope if we all switch to EV’s (52%) down 11% from Feb 2020
Driving in the dark
In the next section we asked how our members felt about driving in the dark. Half of those who drive said they get nervous driving in the dark on unfamiliar roads. The figure was slightly higher for women (58%).
A third of drivers said they get nervous about wild animals on rural roads and 3 in 10 try to avoid driving in the dark where possible.
Headlights
When we asked our members how they operate their headlights, over a third said their headlights are automatic, but the operate them manually to better suit the conditions. Less than half this number said they have automatic headlights and allow them to operate unassisted.
A quarter of respondents said they only operate their headlights in the dark or heavy rain/thick fog. 5% said they use their headlights all the time.
Driving in autumn
With autumn upon us, we asked our members which statements applied to them with regards to any dislikes to driving in autumn. The top three dislikes were:
- Being dazzled by the low sun (81%)
- Other drivers not using their lights correctly (50%)
- Inconspicuous pedestrians/cyclists (48%)
Anxiety behind the wheel
Overall, AA members who drive are relaxed behind the wheel in most situations. Dual carriageway type roads are where our members feel most relaxed (93%). Single carriageway were the second choice with 88% of drivers feeling relaxed on them. A small number (6%) feel nervous driving on urban/city roads.
Of the list of other road users drivers might feel nervous around, the top three were:
- E – scooter/micro mobility users (29%)
- Cyclists (25%)
- Horse riders (24%)
Pavement parking
Over half (57%) of our members indicated that they had the facility to park their cars on a driveway. One in five respondents park on a road or pavement.
Of those who feel there is a problem in the UK with pavement parking (92%) a third feel a nationwide ban on pavement parking with councils carrying out a street by street assessment and where the space could be shared it should be clearly signposted.
28% of those who expressed an opinion feel there shouldn’t be a nationwide ban, but it should be left to individual councils to decide if and where to implement restrictions.
1 in 10 of those who currently park on the road would consider converting their front gardens into a parking space.
Car use and maintenance in COVID
When asked about the impact of COVID on their concern about the cost of car ownership, 1 in 5 of our members who drive said they were concerned but the majority (73%) feel it has had no impact.
When asked what thing they least liked about car ownership the top issue was unexpected repairs (71%). This was followed by buying insurance (44%) and over a third (38%) disliked the cost of servicing.
Finally, we asked if our members were using their cars less since COVID. 50% of drivers said they were not doing as many miles as before, with that figure rising to 62% in Wales.
September 2020
There were 13, 800 responses to the September 2020 survey between 15 and 21 September 2020.
Bank holiday travel
We asked our panellists about their August bank holiday trips. 75% of respondents said that they had not driven anywhere during this period. Of the remaining quarter who did venture out, the average distances travelled on each day were:
- Friday 28 August – 43 miles
- Saturday 29 August – 37 miles
- Sunday 30 August – 36 miles
- Monday 31 August – 42 miles
Rat runs
In the next section of the survey we talked about 20 mph streets and their effect on “rat-running”.
Almost half of those surveyed (45%) said they lived on or near a 20 MPH zone, with Londoners most likely to claim this (74%).
We asked our panel to choose from a list, which statement best represents “rat-running” in their neighbourhood. A quarter agreed that there was a “rat-running” problem before but it had not improved with the 20 mph speed limit. Only 3% agreed that the “rat-running” problem had gone away with the 20 mph speed limit.
Deer conservancy
Deer conservancy groups say there is anecdotal evidence that more deer have been involved in road collisions since the easing of the coronavirus lockdown. When we put this to our survey panel, most said they had not noticed an uplift in the number of animals during or since the lockdown. 16% said they had noticed an increase in wildlife on the roads during or since the lockdown. This figure rose to 20% in the East of England.
Roads Policing
In the August survey, our respondents indicated they thought there was insufficient specialist traffic police across the road network. When asked to choose from a list which approach would be most effective, 28% agreed that pairing neighbouring forces would be the best solution and a quarter felt that creating a National Roads Policing Force would work best.
Private parking enforcement
The government is working with private parking companies (i.e. NCP, Parking Eye) to create a new Code of Conduct which all providers would subscribe to. We asked our panel whether they agreed or disagreed with several statements which might make up this Code of Conduct.
| Survey statement | NET: Agree | Neither agree nor disagree | NET: Disagree |
|---|---|---|---|
| A three-tiered charging system is fairer for drivers compared to a single fee for breaching private parking rules | 75% | 16% | 9% |
| Charges paid within a 'discount period' (i.e. pay within 10 days) should have a 50% discount. i.e. a £100 charge would be £50 if paid within 10 days | 79% | 11% | 10% |
| I am wholly convinced that private parking companies will cooperate fully with a Code of Conduct set by government | 11% | 13% | 76% |
| Appealing a charge from a private parking company should be easy, straightforward, fair and independent from the company issuing the charge | 90% | 4% | 6% |
| There is no need for private car parks to report how much they receive in penalty charges | 10% | 11% | 79% |
| Charges paid within a 'discount period' (i.e. pay within 10 days) should have a 40% discount. i.e. a £100 charge would be £60 if paid within 10 days | 65% | 17% | 17% |
Highway code review
We asked our members to watch a video by Cycling UK which demonstrates a proposed change to The Highway Code where effectively those travelling straight on would always have the right of way. Just under two thirds (64%) agreed with this change.
The Highway Code consultation also includes elements such as introducing a hierarchy of road users. We asked our members if they agreed or disagreed with a number of statements. The top three most agreed with were:
- If these changes are agreed it will need a major public safety campaign to run alongside it to communicate the changes so all road users know what to expect (95%)
- It is all well and good making changes to the Highway Code, but drivers won't abide by them as they don't re-read the Highway Code (86%)
- Having recommended safe distances and speeds when overtaking vulnerable road users are welcome (80%)
Future plans for students
Of those who said they have friends or relatives aged 18-25 who are choosing to take a gap year before going on to further study, a quarter said they would choose to travel where possible. 22% said they would take part in some form of distance learning and this was followed by spending time with family at 19%.
Automated driving
We described the Governments goal to introduce Automated Lane Keeping Systems (ALKS) to UK motorways. When ALKS is activated, the car can pilot itself so drivers can take their hands off the steering wheel and, if desired, do something else (i.e. read a book).
Half of our members felt that ALKS should never be allowed in the UK. If it was introduced, 88% said drivers not be able to carry out other tasks while the system is activated such as read a book. Similarly, 85% said drivers should not be able to carry out tasks via the vehicles infotainment system. Over half (54%) said the vehicle manufacturer should be liable if there was a collision due to a fault with the technology.
High intensity headlights
We asked all respondents who drive about concerns they may have from high intensity LED headlights used on modern cars.
Over 70% of our members who responded claimed to have been dazzled by LED headlights from oncoming cars. Two thirds (65%) think there should be more regulations about the use of LED headlights and almost a third (28%) think the headlights should be a warmer colour. However 20% of respondents did feel that the use of LED headlights improves road safety.
August 2020
There were 16,350 responses to the August 2020 survey between 11 and 18 August 2020.
Car ownership
We asked our panellists how old their current main car is. The average age was 7.15 years old and over a quarter of respondents said their car was over 10 years old. We then asked what fuel type their next car would be, the most popular choice was petrol (28%), followed by hybrid with over 2 in 10 choosing this option.
Cars and work
Of those who drive and work, over a third said they use their own car to travel to and from work, with just 2% having use of a company car. 1 in 10 drivers say they don’t use their cars for work. Of those who drive to work, more than a quarter are not currently driving to work (working from home) but may need to commute again within the next few months.
Driver behaviour
When asked whether they believed driver behaviour had changed since the lockdown 44% said other drivers had got worse. 1 in 10 said they feel more nervous now and 58% claimed they were driving less than before.
UK Road design
We showed our members this picture of a “Dutch Roundabout” recently opened in Cambridgeshire. The roundabout gives right of way to pedestrians first, then cyclists, using the red lanes and finally other road users.
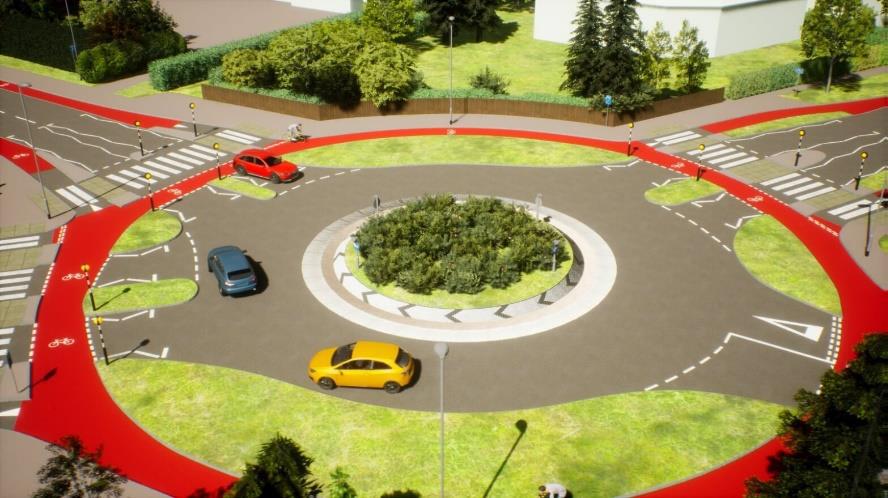
When asked what effect this design might have, over two thirds thought it would cause more collisions. 65% felt it was unclear how this roundabout should be used, and a similar number believed that the design would cause more congestion.
Traffic policing
When asked about traffic policing, our respondents felt that rural roads had the fewest dedicated police officers, with over half rating 1 or 2 out of 5 with 1 being completely inadequate and 5 being more than enough.
Decarbonising transport
We asked our members which modes of transport require the most attention in order to achieve the Governments plans to reduce carbon emissions. Almost 8 out 10 selected HGV’s, followed by Air Transport, vans and buses/coaches.
When asked which solutions from the list provided would have the greatest impact on decarbonising transport. The top three answers were:
- Moving more road freight to rail
- Cheaper fares across all forms of public transport
- A national investment strategy for battery and hydrogen technology
Transport views
We showed our respondents a series of statements and asked which best represented their views regarding transport.
Three quarters felt that an effective transport system requires all forms of transport to work together. 70% indicated that they regarded the safety of others a concern when they are driving. Over two thirds are concerned about the impact transport has on climate change yet 70% of those who responded said they would only use public transport as a last resort.
Driving school
We asked our members how much they thought it would cost to train as a driving instructor. On average the figure indicated was just under £5,000. When asked how long they thought it would take to train as a driving instructor the average response was 10.5 months. Only 9% said they would consider becoming a driving instructor if the training could be done in 3 months.
Car maintenance
When asked which car maintenance checks our members who drive would be most confident to carry out the top 3 answers were:
- Opening the bonnet
- Top up the windscreen washer fluid
- Check the tyre pressures
Over 80% of men who responded said they would be confident in changing a wheel but this figure falls to below a quarter in women.
Driving Habits
Finally, we asked our survey participants if there were any driving habits that they had learned not to do from their parents’ driving. The most popular selection was not driving too close to the car in front with a quarter of respondents choosing this option. This was followed by driving at a snail’s pace(23%).
Not letting the fuel run too low was another popular choice with 2 in 10 drivers choosing this.
July 2020
There were 16,557 responses to the July 2020 survey between 14 and 21 July 2020.
Holiday car journeys
When asked if they were planning on driving anywhere over the upcoming August bank holiday weekend, over a third of respondents said they wouldn’t and less than 1 in 10 had already made plans. We then asked if our members had encountered some kind of disruption to previous summer outings. The top four issues encountered were:
- Delayed by heavy traffic on the way home (44%)
- Delayed by heavy traffic on the way there (44%)
- Bad weather (34%)
- The place we visited was too crowded (28%)
Continuing on the theme of car journeys, our members were asked how they kept children entertained on long trips. Over half said that talking was the main source of entertainment. Traditional driving games like ‘I Spy’ were also popular. Further down the list were snacks and sweets and smartphones.
Driving Test
When asked about how they learned to drive, almost equal halves of respondents said they had professional lessons or had a mix of professional and private lessons.
Just under a quarter of those who only had professional lessons passed first time, with slightly more (26%) passing first time with a combination of private and professional tuition.
Drug awareness
Many drivers have very little knowledge of how long various legal and illegal substances remain detectable in their bodies. A fifth (19%) knew that a pint of beer can remain detectable in the body for up to three hours compared to just one in 20 (5%) who knew that amphetamines (speed) could remain detectable for up to five days.
Our members were better at identifying drug classifications, with 78% correctly identifying heroin as a class A drug and nearly half (45%) correctly identifying cannabis as class B
Driver training/awareness
We asked our members if they thought that drivers who committed relatively minor offences e. g. speeding, should be offered a driver retraining or awareness course, at their own expense, instead of being prosecuted. The majority (87%) of our members agreed with this. Of those agreeing, almost half agreed strongly.
We asked if the course was around £90, over 90% of drivers said they would take this option over potentially having three penalty points on the licence and a £100 fine.
When we asked which motoring offenses from a given list should be dealt with by offering a retraining course, the most popular were speeding just over speed limit (76%), middle lane hogging (66%) and tailgating (53%).
Finally, on this subject, we asked participants about speed cameras. Over 90% indicated that the money from speed camera enforcement should be used to improve road safety and 87% said they always check their speed when passing a speed camera, even if they think it may not be working.
Vehicle repairs
The last section of July’s survey looked at the cost of vehicle repairs over the last 12 months. Almost two thirds of car owners had spent money on vehicle repairs or servicing in this period, with the average amount being just over £200.
Of those who had spent money on repairs prior to March 2020, the most common components that needed attention were brakes, followed by 12V batteries.
June 2020
There were 17, 162 responses to the June 2020 survey between 9 and 16 June 2020. Road conditions
When asked if the Government should use the lockdown time to carry out repairs, the overwhelming majority of those polled said they should (92%).
Only 3 in 10 respondents have seen an increase in repairs in this period, more so in Yorkshire and the North West.
Those in Northern Ireland are more likely to agree that the road conditions are good compared to other parts of the country.
Covid economic support
The top 3 sectors that should get economic support in the wake of the pandemic are, according to our members:
- The hospitality sector (64%)
- High street retail (38%)
- Self-employed manual workers (plumbers, carpenters etc) (36%)
Covid grocery shopping
59% of those completing the survey said they have continued to shop in stores, with those living in Scotland being most likely to do so.
1 in 10 respondents said they have started using on-line grocery shopping services and will continue to use them after the crisis is over.
Covid holidays
Over half of those who took part in the survey have had to cancel holidays due to the pandemic with 26% overseas travel plans cancelled and 25% UK holidays. 1 in 10 respondents have no plans to re-book.
A fifth of people who responded still have a holiday booked and are waiting to see what happens.
Learner drivers
Almost three quarters of our members think that now is a good time for learner drivers to practice as the roads are quieter.
Just under half said supervising a learner makes them nervous, with women (62%) more likely to say this than men.
Almost a third of respondents admitted that they haven’t looked at the highway code since they passed their driving test.
29% believe that learner drivers should be allowed supervised practice on motorways. The vast majority of respondents think it is not OK for someone supervising a learner to look at their mobile phone and even more think it is unacceptable for the supervisor to be over the drink drive limit (99%).
Mid-Covid trips
With the lockdown restrictions being eased in England, we asked what trips our members had taken. The top answers were:
- Garden centre or DIY store (34%)
- Visiting a relative or friend (30%)
- Travelling to a site to exercise (22%)
- Travelling to meet friends in an outside space (15%)
2 in 10 respondents said they haven’t made any journeys for these activities.
Car security
Nearly half of members said they were concerned about the use of technology to defeat modern security systems on their cars and over a third take steps to prevent thieves accessing their cars key signals.
1 in 10 have invested in additional security systems to combat keyless car theft.
Only 1% of our members said they have actually been a victim of this kind of car crime, rising to 4% in London.
Pre-journey checks
We asked those completing the survey what checks they make to their vehicles before embarking on a long journey. The top three responses were:
- Filling with fuel (95%)
- Checking tyre pressures (87%)
- Checking the windscreen washer fluid (86%)
Over 40% would clean their car before the journey, with older members more likely to do this.
Multi car households
People living in London are more likely to only have one car in their household (62%) but this number drops to 48% when we look at the country as a whole.
Over a third of households have more than one car and use them equally.
9% of respondents have a hobby/project car and the most likely region for people to own a vehicle specifically for holidays is Wales.
Car buying
When asked if they had ever bought or would buy a car without first seeing it in person, the majority of those who responded said they wouldn’t (75%). However, a fifth of our members who drive said they had bought a car without seeing it.
Pet hates
The driving behaviours that irritate our members the most are:
- Tailgating (30%)
- Talking on the phone while driving (30%)
- Middle lane hogging (15%)
- Swooping (6%)
Covid health
We asked our survey participants how the COVID-19 crisis had affected their mental and physical well-being. Anxiety and lethargy saw the largest levels of increase with 40% of respondents saying they had experienced increased levels of both.
Insomnia, stress and depression had all also been experienced more by over a third of those who answered the question.
Road Miles
With the increased adoption of alternative mobility (cycling, public transport, shared vehicles etc) the revenue from traditional taxation (VED, fuel tax etc) is likely to decrease. We asked our survey participants which options from a list would be the best way to pay for our roads in the future.
The most popular option amongst respondents was to give every driver their first 3,000 miles free and then charge a price per mile to use the road network, with 17% selecting this option.
This was followed by the option to switch all fuel duty revenue onto car/tax VED so that all drivers pay a much bigger charge to access the network (13%). Men (14% vs 10% women) and older respondents (16% 65+ vs 10% 25-34) were most likely to agree.
1 in 10 (9%) felt that the best way to pay for roads in the future is to introduce tolls on motorways and main roads only with women (10%) being more likely to agree here than men (8%). Across regions, those in Northern Ireland were the most likely to agree (16%).
Covid end date
Finally we asked our members when, if ever, they thought things would return to normal following the pandemic.
Over a third (37%) said they think things will never be the same again, with women being more likely to select this option.
Slightly less than a third feel that normality will resume some time in 2021 and 1 in 10 believe things will be back to normal by the end of the year.
May 2020
There were 18, 129 responses to the May 2020 survey between 12 and 19 May 2020.
Private leasing
When asked about their car purchasing intentions for the next year, 7 out of 10 respondents said they were not planning to change their car or get another one. 12% of our members said they had planned to change cars, but had put it off due to COVID-19
Of those who were planning to make a car purchase, most were intending to use cash and savings to pay for it (65%).
1 in 10 are reducing their budget and looking at older vehicles, with a similar number looking at smaller vehicles for the same reason.
Nearly 1 in 5 people said they were less likely to consider buying from a private seller due to the pandemic.
Young and novice drivers
Over half of AA members that took part in the survey think capping the engine size to 1.4L would improve the safety of young and novice drivers.
The next most popular measure was the use of a telematics insurance product (black box).
Cycling
A third of those who took part in the survey said they were cyclists, with men who live in the East of England being most likely to cycle.
Of those who do cycle, more than half said they always cycle on cycle paths or the road, with that figure rising to 68% for Londoners.
29% said they were riding more on the road since the lockdown began.
“Lockdown” personal space
Over half of our members who responded have spent time in the garden during lockdown, with younger members being more likely to do so.
The second most popular retreat was the garage, with men being considerably more likely to choose this option.
Air quality
In response to the question about maintaining air quality after the restrictions have been lifted, over 8 out of 10 people said they would do at least one thing to help this.
40% said they would drive their cars less and over a quarter said they would try to find ways to work from home.
21% said they would cycle more, 18% said they would purchase an electric vehicle and further 17% would choose a hybrid option.
Paying for COVID-19
When asked how the UK Government should pay for the budget deficit caused by the crisis, over 40% said the solution was to scrap HS2.
A quarter of respondents said we introduce new taxation/duties/levies to corporations and a fifth of those surveyed said the Government should write off any costs associated with the crisis.
New skills
40% of respondents have been using their time in lockdown to enjoy an existing hobby and fifth of our members are using the time to improve a current skill. Over 1 in 10 Londoners have been participating in on-line courses.
I.C.E. Sales ban
Over a third of members surveyed feel that hybrid vehicles should be excluded from the ban of internal combustion engine car sales.
E-mobility
Almost 6 out of 10 of our members who participated in the survey have seen someone using an electric scooter on the pavement or footpath and for those who live in London, the number rises to 84%.
April 2020
There were 19,732 responses to the April 2020 survey between 14 and 20 April 2020.
Insurance
When asked about their insurance, 90% said they have their own insurance, with only 9% being insured as a named driver.
The average annual premium is around £380.00, with Londoners paying over £500 and young drivers 18-24 paying more than double the average.
Almost three quarters of all those with some kind of home insurance have a combined buildings and contents policy.
Use of car during lockdown
Almost a fifth of all respondents have not been able to work at all during the lockdown period with those living in London being more likely to continue working (45%).
There was a 6% increase in those who feel they will be able to work from home after the lockdown has ended, with over a third of all those surveyed doing so currently.
Post COVID-19 lifestyle
During the lockdown period, 27% fewer respondents have continued to drive. Walking has increased from 5% to almost a third of all those surveyed.
Many people say that they will make changes after the crisis, with 45% wishing to see more of their families, 40% doing more outdoor activities and 1 in 5 doing more activities with those they live with.
The most popular option for the first trip after lockdown was to visit a family member, followed by visiting the barber/hairdresser with 12% choosing this.
Over 20% of members say they will drive less than before.
Interrupted DIY
While only a small percentage of our members who responded claimed to have had to cancel contractors, many have plans to do some DIY projects, with a quarter planning to decorate and a fifth planning to renovate their gardens.
Road user behaviour
When asked about the behaviour of car drivers, a quarter of those who responded thought it had deteriorated whereas a fifth thought it had improved. Similarly, 25% of members believe cyclists’ behaviour to have worsened.
Pedestrians faired best with 25% of those who answered thinking their behaviour had improved.
Ban on ICE vehicle sales
With the Secretary of State proposing to bring forward the ban on internal combustion engine vehicle sales, we asked our members when they think it should begin in the UK:
- Think the ban should start after 2040 (27%)
- Think the ban should start before 2032 (15%)
- Think the ban should start from 2040 (14%)
- Think the ban should start from 2035 (13%)
- Think the ban should start from 2032 (8%)
VED Consultation
In the Chancellor's Budget last month (March 2020), the Government unveiled a consultation into Vehicle Excise Duty (VED). At present new cars pay a higher first year rate linked to the vehicle’s emissions, followed by a standard rate of £150 a year.
We then asked AA members, whether they agreed or disagreed with a list of given statements relating to this. The most agreed with statements were:
- Creating a VED rate which a vehicle pays throughout its life is simpler than having a first year VED rate and standard rate VED (54%).
- Vehicles should be put into bands and a VED rate set according to these wider emission bands (54%).
- The current VED system is fine and should remain unchanged (24%).
March 2020
There were 16,641 responses to the January 2020 survey between 10 and 17 March 2020.
Driving to school
When asked whether they have children and if so do they drive their children to school, fewer than 1 in 10 of over 6000 drivers who have children said they actually drive them to school, the vast majority of whom do a journey of less than 10 miles.
37% of those polled who have children drive them to extra-curricular activities outside of school.
Pet hates
We asked our members how they thought driver behaviour had worsened or improved. The top three pet hates that drivers thought had got worse were tailgating, speeding and undertaking, with half or more of respondents citing these issues.
Go-Ultra-Low Campaign
Our respondents who said they intended to buy a low emission vehicle were split in thirds between full EV, plug-in hybrid and a regenerative or self-charging hybrid.
The two aspects of plug-in electric vehicles that our members think have improved are the number of models available and the range (distance before recharging).
The two aspects our responders consider to have worsened are the affordability of these kinds of vehicles and the incentives for purchasing one.
Easter travel
When asked about their Easter travel plans, 4 out of 5 surveyed said they have plans to travel at some stage over the long weekend. A third of those were planning to visit friends or relatives.
15% were planning a trip to the coast or countryside for leisure.
Car buying
We asked our Populus survey respondents what fuel type they would choose for their next vehicle. The least popular choice was diesel with only 11% choosing this fuel type. The respondents were then split between petrol and electric/hybrid vehicles and those who were unsure or had no preference.
Of those who would choose an electric/hybrid vehicle, the most popular choice was full electric.
Driving test habits
A third of those polled said they still drive as they did when they first passed their test, with older drivers agreeing with this most
According to those polled, use of the handbrake whilst stationary is the first technique people stop using,
Car tax
The majority of our members did not feel that the 2020 revision to the VED (vehicle Excise Duty) applied to them or influenced their choice when buying a new car.
February 2020
There were 17, 628 responses to the February 2020 survey between 11 and 18 February 2020.
Electric vehicles (EV’s)
More than half of respondents said they would not consider buying an EV as their next car. Londoners were slightly more favourable to the idea with 56% saying they would consider buying an EV.
The top reason for not considering an EV was a lack of public charging points with almost 7 out of 10 stating this is as their reason. The second biggest reason was purchase cost.
EV Parking
We asked our members to choose between two signs indicating the location of EV charging points. One with a blue “P”, the image of a car being plugged in and the words “Electric vehicle recharging point only”. The second was the same only the “P” was in green. The vast majority (85%) preferred the green sign.
Used car buying
2 out of 5 of those surveyed said they would only travel 5 to 30 miles to buy a used car, with men being more likely to travel further. The top three reasons for travelling further were to say money, for more choice and to find a specific vehicle not available locally.
Car parks
Over 90% of AA members surveyed agreed that car parking spaces are too small and the majority worry that their vehicle will get damaged while parked. Men tended to be more concerned about damage than women.
More than half of respondents said their cars had been damaged while parked and the most common form of damage was a small dent or scratch caused by someone else.
Return to driving
When asked what they would do if returning to driving after a break of over 12 months, more than a third of drivers said they would carry on as normal with the same proportion saying they would stick to local/familiar roads.
Careless driving
A quarter of those who responded said that they struggled to switch off their mobile phones whilst driving with 1 in 10 indicating that they think its OK to send a text or make a call whilst stationary in traffic.
Almost half of drivers said they had made a hands-free call whilst driving.
AA Terminology
When asked what term best described the AA roadside staff, 29% said they preferred “AA Roadside Technician” with “AA Patrol” being the second favourite choice.
January 2020
There were 17, 190 responses to the January 2020 survey between 14 and 21 January 2020.
Parking at home
The majority of those surveyed park on the driveway, with younger members being more likely to park on the street next to their homes.
Warning lights
More than two thirds of respondents have had to use their vehicle handbook to identify a warning light. Female members were more likely to feel anxious if they were unable to identify a warning light.
Car insurance
8 out of 10 of members surveyed said they would be insuring the same car as they did previously.
The average annual premium was £381.22, with younger drivers and those living in London paying more.
Home insurance
Most of our members said they had home insurance and the majority of those held contents and buildings policies. On average those living in London paid more for their home insurance.
Smart motorways
Most of our members understand what smart motorways are and the phrase Emergency Refuge Area (ERA) but only 18% think the government or Highways England have done a lot to keep drivers informed about the different types of motorway, as opposed to 42% who think the AA have.
Only 12% of those surveyed feel that smart motorways are as safe as traditional motorways and nearly half have concerns about their safety and believe a review should take place.
40% of our members would only be prepared to drive a quarter of a mile to reach an ERA with a front wheel puncture.
2030 Goals
When asked which vehicle related goals might be achieved by 2030, just under half believed the price of fuel would reach 170 per litre and over a quarter think all major UK cities will have clean air/ultra-low emission zones that charge private drivers.
Almost three quarters feel the will be no progress on a pothole free UK road network.


