02 October 2025
Figures released by the Department for Transport today* shows that delays are growing across England's road network.
Major road arteries in England are becoming increasingly clogged with the average delay now at 11.6 seconds per vehicle per mile, compared to free flow. That is a 5.5% increase on year ending June 2024.
“We need more national and local focus on ways to keep the wheels turning.”
The AA believes the impact of smart motorways is now firmly under the spotlight as drivers avoiding Lane One, through fear of running into a stranded vehicle, undermines the efficiency and speed of these roads. The AA understands that several Post Opening Project Evaluation (POPE) reports into all lane running schemes have yet to be released, and is calling for their immediate publication.
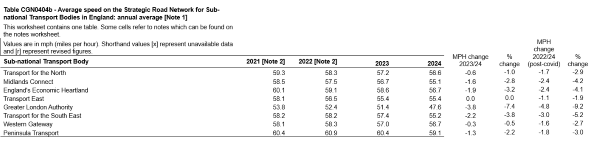
Meanwhile, today’s regional profiles** of the average speed on the Strategic Road Network shows London’s slowing by nearly four miles an hour over the last year, and nearly five miles an hour since covid. The latter shows average road speed on strategic roads around the capital on a path to slowing 10% since covid.
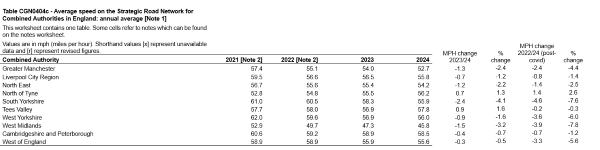
The West Midlands is showing a 7.8% or nearly four miles-an-hour decline while West Yorkshire is down 6.0% since covid.
Over the past year, average speeds on strategic roads around Newcastle and in Northumberland have gone in the opposite direction, improving by 1.3% or nearly one mile an hour. Tees Valley major roads, also in the North East, are doing even better with a 1.6% improvement in average speeds between 2023 and 2024.
Jack Cousens, head of roads policy for The AA, said; "Drivers probably won't be surprised to hear that their journey times have increased over the past year, especially on our motorways.
"With numerous stretches of so-called 'smart' motorway now in regular use, rather than improving traffic flow it seems to have created more bottlenecks. There are several reports about these schemes which have not yet been released by the Department for Transport which would show what, if any, improvements drivers have experienced. We need these documents released to understand what traffic flow benefits have been made, alongside a value for money assessment on these motorways drivers perceive as dangerous.
"On local roads, the average delay now stands at 46.2 seconds per vehicle mile, while in London, speeds have fallen by 4 miles per hour in a year. With the vast majority of travel made by car, as well as goods and services using the road network, we need more national and local focus on ways to keep the wheels turning."
* Road traffic statistics - GOV.UK;
**