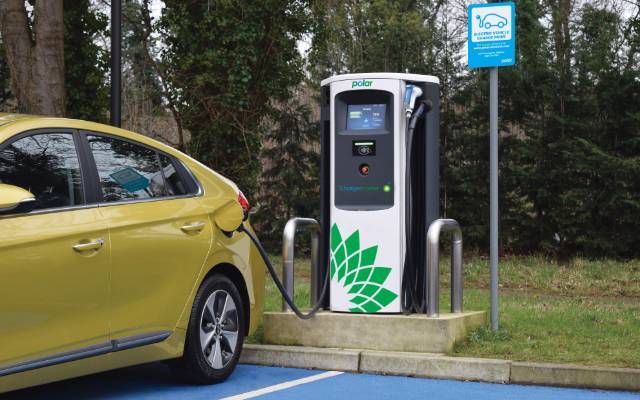
Private EV ownership accelerates with biggest quarterly rise on record

-
Private EV ownership tops 860,000
-
Record quarterly rise sees more than 83,000 privately owned EVs added
-
Wales records the fastest growth among UK nations, East Midlands leads England's regions
-
"The strongest growth is no longer confined to traditional EV hotspots." – AA President
Private ownership of electric cars continued to gather pace in the first quarter of 2026, with more privately owned EVs added than in any previous quarter, according to new analysis by The AA*.
Department for Transport vehicle licensing statistics show there were 860,334 privately owned battery electric cars on UK roads at the end of the first quarter of 2026. That is up by 271,382 on the same period last year and by 83,136 from the end of 2025, a rise of 10.7% in three months and the largest quarter-on-quarter increase on record.
The latest figures suggest private demand for electric cars continues to strengthen. Greater model choice, improving battery technology and a buoyant used EV market are helping to bring electric motoring within reach of more households than ever before.
Rising fuel prices make EVs more attractive
The AA’s June EV Readiness Index also suggested that "range anxiety" is increasingly being replaced by "pump anxiety". Following the conflict in the Middle East, higher oil prices have driven up the cost of petrol and diesel, making the lower day-to-day running costs of electric vehicles an increasingly important consideration for many drivers.
Growth is also becoming increasingly widespread across the country. While London and parts of the South East continue to have the largest concentrations of privately owned EVs, the fastest rates of growth are now being seen elsewhere in Britain, highlighting how electric motoring is becoming a mainstream choice rather than one confined to early adopters.
Wales leads the home nations
Among the UK's nations, Wales recorded the strongest annual growth in private EV ownership, increasing by 55.1% over the past year. England, Scotland and Northern Ireland all recorded annual growth of over 45%, highlighting the continued growth in private EV ownership across all four UK nations.
| Nation | Q1 2025 | Q1 2026 | Change | % Change |
| United Kingdom | 588,952 | 860,334 | +271,382 | 46.1% |
| Wales | 20,958 | 32,513 | +11,555 | 55.1% |
| England | 510,363 | 743,877 | +233,514 | 45.8% |
| Scotland | 49,288 | 71,600 | +22,312 | 45.3% |
| Northern Ireland | 8,109 | 11,774 | +3,665 | 45.2% |
The fastest-growing local authority in the UK was Blaenau Gwent, where private EV ownership increased by 84.8% over the year.
East Midlands tops the regional table
Within England, the East Midlands experienced the fastest growth in private EV ownership, with the total increasing by 58.8% over the year. The North West (58.4%), West Midlands (57.1%), North East (56.5%) and Yorkshire and The Humber (55.9%) all posted growth well above the national average.
By contrast, London's increase of 22.7% was the lowest of any English region, reflecting its position as one of the country's earliest adopters of electric vehicles.
| English Region | Q1 2025 | Q1 2026 | Change | % Change |
| East Midlands | 44,822 | 71,184 | +26,362 | 58.8% |
| North West | 57,320 | 90,790 | +33,470 | 58.4% |
| West Midlands | 45,699 | 71,807 | +26,108 | 57.1% |
| North East | 19,808 | 30,993 | +11,185 | 56.5% |
|
Yorkshire & The Humber |
42,840 | 66,802 | +23,962 | 55.9% |
| East of England | 64,710 | 93,809 | +29,099 | 45.0% |
| South West | 53,829 | 77,250 | +23,421 | 43.5% |
| South East | 109,268 | 152,785 | +43,517 | 39.8% |
| London | 72,067 | 88,457 | +16,390 | 22.7% |
At local authority level in England, Knowsley recorded the fastest annual growth in private EV ownership, increasing by 82.9% over the year. It was followed by Hull (82.6%) and Sandwell (77.7%). Also featuring in the top 10 were Bolsover, Hyndburn, Burnley, Boston and Walsall, underlining how the strongest growth is spreading well beyond the country’s traditional EV strongholds.
At the other end of the table, Kensington and Chelsea recorded the slowest growth among London boroughs, at 2.3%. Outside the capital, the weakest rises were seen in Hertsmere, Elmbridge and Three Rivers, reinforcing the trend that some of the country's earliest EV adopters are now seeing slower rates of growth than areas where electric motoring is only just beginning to accelerate.
Edmund King, AA President, said: "Private ownership of electric cars continues to move from strength to strength. More than 83,000 additional privately owned electric cars were added in just three months, showing that more drivers are making the switch to electric motoring.
"It's also encouraging to see where that growth is taking place. The strongest increases are no longer confined to the areas that embraced electric cars first. Wales led all four UK nations for annual growth, while the East Midlands topped the English regional table, with strong performances right across the Midlands and the North.
"The continued expansion of the used EV market is helping to bring electric motoring within reach of many more households. This may be due to drivers feeling higher fuel prices following the conflict in the Middle East which have reminded many just how expensive petrol and diesel can become, making the long-term running costs of an EV even more attractive.
“There is still more work to do on charging infrastructure, particularly for those 40% of households without any dedicated off-street parking”
Across all ownership types, there were 1,864,018 electric cars on UK roads at the end of the first quarter of 2026, up by 461,382 (32.9%) compared with the same period last year. This included 974,264 company-owned electric cars, an increase of 183,205 (23.2%) year-on-year.
As of the end of July 2026, there are over 2,150,000 fully electric cars in the UK. This means that around 6.2% of the c.34.8 million cars on UK roads are fully electric.**
*The figures are based on Department for Transport vehicle licensing statistics for privately owned battery electric cars. DfT/DVLA table VEH0142 The quarter-on-quarter comparison is between Q4 2025 and Q1 2026.