Thinking of buying a new car? Or wondering whether public transport could be cheaper than driving? There are lots of costs that come with owning a car. Our handy guide will help you calculate how much your car costs you.

Types of driving costs
Running costs
The day-to-day costs of actually using the car. This includes petrol and servicing.
Standing charges
Costs related to owning a car and keeping it available to use. You have to pay these whether you use the car or not. This includes things like tax.
|
In this article: |
Running Costs
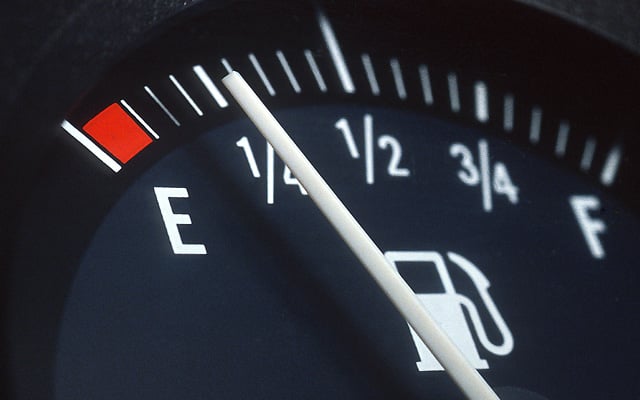
Fuel
There are 4 factors that affect your fuel cost per mile:
- Fuel price
- Fuel type
- The car's efficiency (fuel consumption)
- The way you drive
Diesel’s more expensive than petrol, but you get more miles per gallon. But the bigger the price gap, the longer it’ll take you to recover the extra cost on buying a diesel in the first place. You'll need to be a high mileage driver to make diesel a more economical choice than petrol.
Pump prices vary quite a lot around the country and between brands. Get to know the cheapest in your area and shop around when you're away from home.
How to calculate fuel cost per mileCost per mile (pence) = Litres x Fuel price / Number of miles Annual running cost (converts to £) = Cost per mile x Average mileage / 100 |
Tyre replacement costs
In a 4 year period, a car could go through a complete set of new tyres. When calculating the cost of replacing tyres, include the valve, balance and the disposal charge for the old tyre. Shopping around for tyres can help to keep costs down too, as main dealers will be pricier.
You should also factor in other replacement items like windscreen wiper blades.
How to estimate replacement parts running costAnnual running cost = Total of all items bought for car Cost per mile (pence) = Total cost / Annual car mileage x 100 |
Service and MOT costs
If your car is over 3 years old, it'll require a yearly MOT. This is a legal requirement and ensures that your car remains road-worthy.
It's not legally required to get your car serviced but it is highly recommended. Although it costs money, a service can make your car more efficient and also helps to flag and fix niggles before they turn into a bigger - and costlier - problem.
How to calculate wear and tear running costsAnnual running cost = Your annual service bill Cost per mile (pence) = Service bill / Annual car mileage x 100 |
Labour and replacement part costs
Labour costs can be charged by garages to cover normal servicing and parts replacement. Labour rates vary a lot depending on where in the country you are as well by brand.
Car parts which might need to be replaced regularly under normal driving conditions include brake materials, oils, filters, bulbs and wipers. However, you might sometimes need to replace a bigger part like an exhaust.
How to calculate labour and parts running costsAnnual running cost = Total of all items bought for car Cost per mile (pence) = Total cost / Annual car mileage x 100 |
Parking and toll costs
This will vary depending on where you live and how you use your car. It could be just a few pounds here and there for parking in city car parks. But, it could be a large regular cost if your commute includes a toll road or you park your car in a station car park and get the train to work.
Check out how much commuting to work will cost before you decide whether to drive or take public transport. We have information on the London Low Emission Zone and the Dart Charge.
Standing charges
Car tax
Cars registered between March 2001 and April 2017
Car tax is based on the amount of CO2 produced (based on official figures shown on the V5C registration document).
Cars registered after April 2017
The first year rate for a brand new car is based on CO2; but the standard rate is the same for all vehicles except those with zero emissions.
An additional charge is payable for 5 years after the first year on cars with a list price of more than £40,000.
How to calculate tax costsAnnual running cost = Car tax bill Cost per mile (pence) = Tax bill / Annual car mileage x 100 |
Insurance
To get a car on the road, you have to get it insured. Choosing a car in a lower insurance group should mean lower premiums, as may choosing a policy with limited cover.
- Third party insurance is the minimum but only provides basic cover – damage to other property or injury to others where you're found to be at fault. Repairs to your vehicle, theft or damage by fire aren’t covered.
- Third party fire and theft insurance gives the same basic cover, plus protection against loss or damage due to fire or theft.
- Fully comprehensive includes cover for damage to your own vehicle and often includes other benefits, too.
Get quotes comparing different types of cover as fully comprehensive insurance can sometimes work out cheaper, even on an older car.
How to calculate insurance costsAnnual running cost = Your annual insurance bill Cost per mile (pence) = Insurance bill / Annual car mileage x 100 |
Loan interest and cost of capital
When you buy a new car, you'll either pay up front or borrow money. If you need to borrow to buy a car (whether it's a loan or a finance plan) remember to take into account the interest and other fees.
If you use cash, then any interest you could otherwise have earned on that money by saving it should be taken into account too.
Depreciation
Depreciation – loss in value over time – is easy to overlook, but it’s likely to be one of the biggest costs.
Newer or more expensive cars are likely to cost you more in depreciation but, whatever the car, you can minimise it by:
- Keeping your car in a good and clean condition.
- Dealing with minor repairs.
- Keeping mileage low.
- Arranging servicing to the manufacturer's schedule.
- Keeping a comprehensive service record.
How to calculate depreciation costsAnnual depreciation cost = (Value when bought - Current value) / Years owned Cost per mile (pence) = Depreciation / Annual car mileage x 100 |
Breakdown cover
Although it's not a necessity, breakdown cover is highly recommended for peace of mind. The cost will pay for itself when you find yourself stranded on the way to somewhere important.
Our breakdown cover provides 24/7 roadside assistance if your car breaks down. We’ll try to fix it at the roadside and if we can’t, we’ll take you and your vehicle to the nearest garage. Depending on the level of cover you choose, we can also provide onward travel for the rest of your journey.
Take a look at our breakdown cover.
Claiming mileage
Approved mileage rates are set by HMRC and reviewed from time to time. If you're looking for mileage costs or mileage rates, you should check their site.
How much your employer will give you for using your own car for company business depends on the employer and is a matter for negotiation as circumstances vary.


