Yonder summary December 2022
There were 13,480 responses to the AA Yonder November survey between 9 and 20 December 2022.
In this survey
- Driving Habits
- Driving offences
- Seat belts
- Ultra-Low Emission Zones
- Road Signs and Markings
- 2030 Achievements
- Fixed Penalty notices
- Car Keys
- Vehicle mix
- Winter road treatment
Driving Habits
We opened the December survey by asking our members who drive, what from a given list of habits and techniques, did they stop doing after passing their driving test.
Almost one in four (38%) of our panel said they had stopped using the handbrake when stationary in traffic. More than one sixth (15%) said they had stopped sticking to speed limits. This was significantly higher in male drivers than female (17% vs 10% repsectively).A third of drivers said they still drive the same as they did when they took their test.
Driving offences
Next, we asked our panel to provide a rating from 1 (being no chance at all) to 10 (being certain) on whether they thought drivers would be caught and punished for committing certain driving offences on roads in their area.<
Almost a quarter of respondents (24%) indicated they were certain that driving in a bus lane would lead to prosecution in their area.
One in ten thought that speeding would lead to being caught and punished where they live.
The third most likely offence to get caught and prosecuted for was drink driving, with one in eight members indicating this would likely be the case in their area.
The least likely offences to get caught for, according to our survey respondents were careless driving (59%), driving a vehicle in dangerous or defective condition (50%) and driving without a seatbelt (50%).
Seat belts
We wanted to understand people's habits and behaviours around wearing seatbelts. Firstly, we asked our members at what stage did they put their seat belt on when driving.
Almost half said they put the seat belt on after starting the engine but before driving away (49%). A similar number indicated they would put the belt on prior to starting up the car (46%).
Only 4% indicated they would pull out of the driveway or parking space before belting up.
We went on to ask if people felt that penalty points should be introduced as part of the punishment for not wearing a seatbelt. The majority of our panel (57%) felt this should be introduced, with less than a third disagreeing and one in ten unsure on the topic.
Remaining on the topic of penalties, we asked how many points should be given for not wearing a seatbelt. An overwhelming majority (78%) agreed three points would be appropriate (aligned with offences like speeding).
Ultra-Low Emission Zones
With more Ultra-Low Emission Zones (ULEZ) and Clean Air Zones (CAZ) being introduced across the country, we asked our members, what steps they thought local councils should take prior to their introduction.
By far the most popular step from the list given, was for local councils to invest in Park and Ride facilities, so people can use public transport before entering the charge zone. Seven out of ten (70%) chose this option.
A similar number of respondents (67%) believe that councils should invest in bus services, including off peak services.
Over half of our panel felt the authorities should offer a financial scheme to help people switch from non-compliant vehicles, such as a scrappage scheme or 0% finance.
The next most popular options were to invest in rail services (45%) and improve pavements and walking routes (44%).
Road signs and markings
In the next section of the survey, we asked our members which, from a list of issues, they found most annoying whilst driving on their area.
The top answers were:
- Incorrect or unclear road markings (26%)
- Overgrown hedgerows (21%)
- Temporary road signs which no longer apply e. g. from roadworks (20%)
Next, we asked our panel which achievements, from a list of ten options, they felt would be achieved by 2030.
Over half of our panel (51%) chose the option that the pump price of fuel would reach 230 pence per litre, this was by far the most common answer.
More of our panel thought that the AA would launch its first drone patrol than thought 50% of new car sales would be fully electric (25% vs 24% respectively).
Only 2% of AA members believe that the UK would have a pothole-free road network by 2030.
Fixed penalty notices.
Evidence suggests that drivers being caught and fined for offences like driving in bus lanes, stopping in yellow boxes or illegal parking are more likely to be non-locals. We asked if any of our members had received such penalties and whether they were out of their local area at the time.
While twice as many people indicated that they had received a penalty away from their local area than those nearer home, the overwhelming majority (93%) of respondents had received no penalties at all.
Car Keys
The next couple of questions focused on how people feel about car keys in regard to purchasing a used vehicle.
Almost all of our panel would expect a used car to be supplied with two keys (98%) and when asked how they would feel if the car only had one key, the majority of respondents (58%) said they would feel annoyed as they would have to spend money on a second key.
The next most common emotion for this scenario was worry, as people would be concerned, they might lose the only key they had with 46% of members feeling this way.
2030 Vehicle mix
With the 2030 ban on sales of new petrol or diesel cars on the horizon and only 1.5% of UK cars currently being fully electric, we asked our members what they thought the vehicle fuel type mix would look like in 2030.
Almost one in four felt that petrol would be the most common fuel type.
Fully electric narrowly beat diesel with 18% vs 17% respectively. Hydrogen got the least selection with just 4%.
Winter road treatment
We rounded off the December survey by asking our members who drive, what their expectations of being able to drive this winter were should there be significant snowfall or ice in their home areas.
Over a third (35%);of our driving members said that the roads between their home and the nearest main road are unlikely to be treated for snow and ice, but they would travel anyway and hope for the best. Over a fifth (21%) however, would wait until the roads were cleared before attempting to drive. BACK TO TOP
Yonder summary November 2022
There were 12,372 responses to the AA Yonder November survey between 12th and 22nd November 2022.
In this survey
- Blind spots
- Santa's breakdowns
- Barriers to EV purchase
- Christmas journeys
- Road conditions
- Christmas activities
- Remote car purchasing
- New Year resolutions
- Escaping from Christmas
Blind spots
We opened this month’s survey by asking AA Panel members who drive about blind spots.
More than two in ten, said they have a car with a side pillar next to or just behind the driver that creates a significant blind spot that they have to be aware of (22%).
Similarly, two in ten, said they have a car with a windscreen pillar that creates a significant blind spot. (20%).
Over one in six, revealed they have in recent years had a near-miss that can be attributed to a blind spot (17%). This was higher for men when compared to women (18% vs 15%) and respondents aged 55-64 (20%).
Santa's breakdowns
In line with the festive season, panel members were given a list of issues that they think would cause Santa’s Sleigh to break down. Sleigh overload was voted as the main issue (29%), followed by Reindeer running out of fuel (17%). one in seven, said low levels of Christmas Spirit (14%) would cause Santa’s Sleigh to break down.
Almost one in ten, said Santa’s Sleigh would break down because Rudolph’s nose stopped shining and because of collapsed suspension (both 9%). 5% said the naughty or nice radar stopped working and the jingle bells not ringing.
Barriers to EV purchase
Panel members were then asked what would be factors/issues that would act as a barrier to purchasing an Electric Vehicle (EV). The main barrier for panel members is the high purchase price (69%), this was higher for women in comparison to men (72% vs 68%).
More than half said a lack of rapid charging points on motorways for long-distance driving would be a barrier (53%).
The third most selected reason was the length of time to offset higher purchase price against lower running costs (46%).
Christmas journeys
Just under half of our respondents indicated they were planning a journey by car over the Christmas period (45%)
When asked which days on and around Christmas they plan to use their car for a journey involving main roads or motorways. Over half of those planning a journey, plan to travel on Friday 23rd December (51%) and half plan to travel on Christmas eve (50%) with the main reason being to visit family and friends.
Respondents were most likely to visit family on Christmas day (39%) and when it came to shopping/ other day trips, they were most likely planning this for Saturday 17th December (20%).
Road conditions
Respondents were then asked to rate the conditions of the road surfaces close to where they live (0 = terrible and 10 = excellent). For residential roads and main roads, an average score of 4 was given.
One in ten Panel Members from Scotland (11%) rated residential roads as terrible (rating of 0), whilst in the Southeast a rating of 3 was given by 16% of respondents. Londoners and those in Wales were more likely to rate the condition of road surfaces near where they live positively as 6 and 7 (13% and 16%, respectively).
Next, panel members were asked to rate the general level of congestion on roads near where they live. For residential streets, the average rating was 6. When looking at the levels of congestion on main roads the average rating was 5.
Christmas activities
Respondents were asked which, if any, of the following Christmas activities they are attending this year. Two-thirds of respondents said they were going to a family/friend's house (66%), this was significantly higher for those in the middle-aged groups of 25-34 (85%).
Over 4 in 10 respondents (45%) said that they were hosting family/friends at their house. This was significantly higher for those in the older age bracket of 55-64 (47%)
A third (33%) of respondents said they were meeting family/friends at a restaurant. This was significantly higher for women than men (41% vs 29%). This was also significantly higher for those residing in London (37%) and Northern Ireland (48%).
Remote car purchasing
AA Panel Members were asked whether they had ever bought a car without seeing it in person first.
Just over one in five (21%) respondents said that yes they had, with slightly more men than women likely to do so.
Of those who had bought a car without seeing it in person from a dealer or an online car-selling platform, they were asked; what made them feel confident about buying the car without seeing it first. Almost three in five (57%) respondents said that it was because it came with a warranty and just over half (52%) said that they felt confident because it was from a well-known national dealership/platform.
New Year resolutions
AA Panel Members were next asked about their New Year’s resolutions and which, if any, would they choose. Almost one in five (17%) said that they would try to walk more. This was significantly higher for women vs men (20% vs 16%).
Over two in five (41%) of AA Panel Members said that they do not make any new year’s resolutions.
Escaping from Christmas
We ended the November survey by asking respondents if they had done anything, from a given list, to give themselves some space from other members of the household at Christmas in the past. Almost 2 in 5 said they had gone for a walk (38%).
12% of respondents said that they had spent time in the garden and 9% said that they had found an excuse to go for a drive.
Yonder summary October 2022
There were 13,091 responses to the AA Yonder October survey between 11th and 19th October 2022.
In this survey
- Driving pains
- Net Zero plans
- Basic car checks
- Speed limits
- Impact of not driving
- Cost of living crisis
- Cancelled road trips
- British Summer Time ends
- New driver advice
- Behaviour following a crash
Driving pains
We opened the October survey by asking our AA members who drive, what kind of physical pain they had experienced while driving.
Just over one-third of panel members had experienced back pain (34%), this was significant for those aged 25-34 (42%) and those aged 35-44 (43%).
Almost 2 in 10 had experienced neck strain (18%), with women significantly more likely to experience this than men (20% vs 18%). Experience of neck strain was also significant for those in the age groups of 25-34 (24%).
Net Zero plans
Respondents who drive were then asked when they think they will swap from a combustion vehicle to a fully electric vehicle (EV).
Almost three-quarters of drivers indicated they would swap at some point in the future. The most selected time scale was more than eight years with 22%. The next most likely time was five to eight year's with 18% selecting this option.
Just over one in ten indicated they would likely make the switch in four to five years' time (11%).
The survey asked panel members how likely they think the new PM (Liz Truss) and her cabinet will keep their commitment to banning the sale of new petrol and diesel cars and vans from 2030 (this was asked before Rishi Sunak was elected by his party to be the new Prime Minister).
More than half believed it was unlikely (52%). Panel members from Scotland (58%) and Northern Ireland (63%) were significantly more likely to believe it was unlikely that the commitment would be honoured.
2 in 10 thought it was likely (22%), and men were significantly more likely to think this compared to women (24% vs 20%).
Basic car checks
AA panel members were then asked how often they check the condition of their tyres, lights and wiper blades. Almost 3 in 10 check their tyres monthly (28%) followed by 26% who check weekly.
Over 1 in 5 check their wiper blades monthly (23%)
A quarter of respondents check their lights weekly (25%). Significantly more likely to check weekly were men (29%) and those aged 65+ (28%).
Speed limits
We asked AA panel members what they think the default speed limit should be on the following road types. For motorways and dual carriageways, more than half believed 70MPH should be the speed limit (51% and 50%).
For Single Lane A Roads, 33% of panel members believed 60MPH should be the limit, whilst, on main roads, 35% believed the limit should be 60MPH.
On residential roads, 58% believe 30 MPH should be the speed limit and for rural roads without pavement, 26% believe 50MPH should be the limit, closely followed by 25% believing 40MPH and 30MPH should be the limit.
Impact of not driving
AA members were asked about the extent to which they agreed with the statements in relation to not being able to drive. The majority agreed that they would not be able to see friends and family as much (79%). This was significantly higher for women (83%) and those aged 18-24 (91%).
Over three in five respondents agreed they would feel isolated from the outside world (63%)
Almost half agreed they would feel lonely if they did not have a car (49%), significantly more so those in the younger age brackets of 18-24 (76%) and 25-34 (59%).
41% Agreed that they would be unable to get to work, whereas 26% disagreed. Disagreement on getting to work was significantly higher among those living in London (40%).
Cost of living crisis
With the cost-of-living crisis impacting household budgets, all panel members were asked what, from a list of given options, have they done or are willing to consider doing to bring down their monthly bills.
More than half of respondents were already reducing the number of takeaways/meals out (57%) and 65% reduced their household heating, whilst 66% reduced their household electricity usage.
Over half of panel members would consider selling unwanted/used goods (55%) and almost half (47%) would consider cancelling TV/streaming subscription services. 46% would consider changing supermarkets to reduce their monthly bills.
Respondents were then asked to imagine if they had to give up using their car due to the cost-of-living crisis what would they consider as a suitable alternative.
70% of respondents considered public transport to be a suitable alternative, this was most significant amongst women (73%), those aged 65+ (75%) and those living in London (83%).
Walking was considered the second most suitable, with nearly two-thirds (64%) choosing this option.This was followed by staying at home (33%), which was most significant amongst women compared to men (36% vs 32%) and those aged 25-34 (45%).
Cancelled road trips
We asked respondents which, from a list of possible events, would make them change their driving plans. Over 8 in 10 said a red weather warning would prompt them to alter their driving plans (82%). This was significantly higher for women (89%) and those living in Scotland (86%).
Over 6 in 10 said a red traffic warning would make them change their plans (63%), this was highest amongst those aged 65+ (67%) and those who live in Scotland (66%) and South East and South West (65% respectively).
Getting drunk the night before would change the driving plans of 62% of panelists, particularly those aged 18-24 (79%).
British Summer Time ends
When asked about their preference regarding Greenwich Mean Time (GMT) vs British Summer Time (BST). 4 in 10 panel members said they preferred to stop changing the clocks and adopt continuous BST all year round (40%). Whilst 34% prefer to continue as we are with changing the clocks twice a year.
Two in ten respondents, said they had no preference (20%) with those aged 18-24 significantly more likely to have no preference (36%).
New driver advice
When asked what advice they would give to a new driver, our AA Panelists’ top advice would be don’t drink and drive (28%)
The second most selected piece of advice was to drive to the conditions (16%) and the third recommendation would be to respect other road users (14%).
Behaviour following a crash
When asked to imagine if they were the first person to arrive at the scene of a road traffic accident, over 6 in 10 respondents would stop and call emergency services (61%). This is significantly higher for women compared to men (70% vs 57%).
This month’s final question asked respondents to imagine that they were involved in a collision that caused damage to their car but were able to drive home. They were then asked whom they would turn to for help and advice on what to do about repairing the car. One in four said they would turn to the AA (25%).
Yonder summary September 2022
There were 12,545 responses to the AA Yonder September survey between 13th and 20th September 2022.
In this survey
- Used car buying
- Cycling on public highways
- Driving theory
- New cabinet priorities
- Public facilities for drivers
- Driving in Autumn
- Rising powers costs and EVs (Electric Vehicles)
Used car buying
We started the September survey by asking our AA members how they felt about buying a used car from an accredited dealership compared to a dealership without independent accreditation. Our panel was split on the subject with 46% saying they would feel more confident. This figure rose amoung female and younger drivers with 51% and 59% repectively feeling a lot more confident.
We then went on to ask what our members would be most concerned about were they to buy a used car tommorrow. The biggest concern was that dealer might hide something wrong with the car, with women being more concerned about this than women (71% vs 67%).
Cycling on public highways
The previous Transport Secretary has recently announced that cyclists guilty of death by dangerous cycling should receive the same sentences as drivers convicted of dangerous driving.
With this in mind, AA panellists were asked to estimate how many deaths they think were caused by cyclists each year. Over 1 in 7 indicated between 51-100 deaths were caused by cyclist each year.
Respondents were then shown a series of statements and asked to what extent do they agree or disagree with them. The top 3 statements respondents agreed the most with were:
- Speed Limits should also apply to cyclists (86%)
- Cyclists should have compulsory insurance to ride on public roads (71%)
- Local roads require more investment to make cycling safer (68%)
Our panel were then shown rules from The Highway Code and asked if they agreed with them. The first extract shown was rule 66 ‘Be considerate of the needs of other road users when riding in groups. You can ride two abreast and it can be safer to do so, particularly in larger groups or when accompanying children or less experienced riders. Be aware of drivers behind you and allow them to overtake (for example, by moving into a single file or stopping) when you feel it is safe to let them do so.
The majority of respondents agreed with this rule, with just 15% not agreeing. This number rose to 18% for those living in London
The second rule shown from The Highway Code was Rule 21 ‘On narrow sections of road, on quiet roads or streets, at road junctions and in slower-moving traffic, cyclists may sometimes ride in the centre of the lane, rather than towards the side of the road. It can be safer for groups of cyclists to ride two abreast in these situations. Allow them to do so for their own safety, to ensure they can see and be seen. Cyclists are also advised to ride at least a door’s width or 1 metre from parked cars for their own safety’.
This was the least agreed with rule of those given in the survey, with over a quarter of respondents disagreeing.
The most agreed with of the three statements offered was rule 163 ’Overtake only when it is safe and legal to do so. You should leave at least 1.5 metres when overtaking cyclists at speeds of up to 30mph, and give them more space when overtaking at higher speeds’. Almost 9 in 10 agreed with this rule (89%).
Driving theory
Staying with the Highway Code, our members who drive were offered a number of statements to which they could agree or disagree regarding their experience with driving test theory.
Of these, the most agreed with statement was was ‘I studied driving theory using a printed copy of the Highway Code’ with 77% agreeing. This was higher in women with 83%.
The least agreed with statement was ‘I studied driving theory using a mobile app (such as a theory test practice app)’ with less than 1 in 10 agreeing (6%).
New cabinet priorities
We asked respondents what their top priority should be following the appointment of a new Prime Minister. Almost 2 in 5 (37%) respondents said that the top priority should be the cost of living. This was most significant for those younger age brackets of 18-24 (60%)
A quarter (25%) of respondents felt that the economy, in general, should be prioritised. This was most significant for those in the oldest age bracket of 65+ (27%)
The new Prime Minister has appointed Anne-Marie Trevelyan MP as the new Secretary of State for Transport. We asked respondents their opinion, on what should be their top priority. Just under a quarter (23%) felt that this should be to provide more money to repair/upgrade local roads. Secondly, under 1 in 5 respondents (17%) felt that a priority should be to scrap smart motorways.
Public facilities for drivers
In our next question, we wanted to guage peoples experiences with public facilities when on long summer journeys. From a list of given scenarios, the most agreed with were as follows:
- On a motorway journey when someone in the vehicle needed the toilet, they were able to pull in at a service area and found a toilet without trouble. (37%)
- On the main road when someone in the vehicle needed the toilet, they were able to find a toilet after pulling into a petrol station or service area (22%)
- On a main road when I or someone in the vehicle needed the toilet, we had to pull off the road because the situation became desperate (13%)
Driving in Autumn
We asked AA Panel Members what they dislike about driving in the Autumn. The majority of respondents - 7 in 10 (72%) - dislike the dazzle from the sun when it is low in the sky.
Almost half of the respondents (48%) dislike inconspicuous pedestrians/cyclists
Following on, over 2 in 5 respondents (45%) dislike other drivers not using their lights properly. This is significantly more likely for men (48%) compared to women (40%)
Rising powers costs and EVs (Electric Vehicles)
We closed our September survey with some questions around the rising cost of electricity and how that may effect peoples decisions regarding buying an electric vehicle.
3% of our panel already own an EV. I in 10 indicated that the rising energy cost was there main reason for not switching to an EV and a further 63% said it has put them off buying an electric vehicle. However, it is not the sole reason.
For just under a quarter of AA Panel Members (24%), the rise in energy costs has not put them off switching to an EV.
Yonder summary August 2022
There were 13,327 responses to the AA Yonder August survey between 16th and 23rd August 2022.
In this survey
- Driver behaviours
- Fuel savings
- Learning to drive
- Travelling to purchase cars
- Carguments
- Driving to work
- MOT test knowledge
- Highway code knowledge
Driver behaviours
We opened the August survey by asking our AA members who drive, what behaviours from other drivers irritate them most. Almost a third of our panellist's found tailgating the most annoying, with women more likely to be irritated by this than men (35% vs 28%).
Using a mobile phone whilst driving was the second most irritating behaviour, with over one in five of our panel selecting this option (21%).
The third most annoying driving behaviour was middle-lane hogging. 17% of our overall driving panel selected this, with a fifth of male drivers selecting this option.
Fuel savings
Our next questions focused on our panels efforts to save fuel in the light of rising living costs. Firstly we asked what type of fuel our member's main vehicle used. Unsurprisingly, petrol and diesel powered vehicles were the most common, with petrol the most popular (59%). This number was significantly higher for our female drivers, 70% of whom drive a petrol powered vehicle.
Diesel vehicles are being driven by over a third of our panel (36%), and this rises to over two in five of our male respondents(41%).
The remainder was made up of hybrid, plug in hybrid and fully electric powered vehicles.
We went on to ask if those driving ICE (Internal Combustion Engine) powered vehicles had taken steps to improve their vehicles fuel economy with the majority of of ICE powered vehicle drivers indicating they had (82%).
Of those taking steps to improve their MPG (Miles Per Gallon), almost half (49%) focused on smooth driving (gentle acceleration and braking). Reducing the use of air conditioning was also a popular choice, particularly among female drivers, with 43% choosing this way to save fuel.
Of those trying to improve their MPG using the options given, nearly two in five of our overall driving panel (38%) had seen benefits and this number rises to almost half in male drivers (46%).
A small minority reported a reduction in fuel economy (3%) and just over a third were unable to discern whether their driving behaviour had affected their MPG (36%).
Learning to drive
In this section of the survey, we asked our members who drive, what driving techniques were covered in their lessons when they were learning.
Nearly 9 in 10 (89%) reported mirror, signal and manoeuvre topics were covered.
82% of respondents said ‘turn in the road’ manoeuvres were covered, as too were left and right reversing around corners (78%), plus hand signals (61%).
In younger drivers, over three quarters reported learning basic car safety checks (78%) but this fell significantly in older age groups with less than a third of over 65s (27%) having covered this topic.
Almost half reported covering vulnerable road users (horses, cyclists and pedestrians) (44%) in their lessons. This was significantly higher than those in the younger age brackets of 18-24 (58%).
Travelling to purchase cars
The next section asked panel members how far they would be willing to travel to buy their ideal used car. The most selected option was between 6 and 30 miles (36%). Over a quarter (26%) were willing to travel between 31 and 60 miles.
When asked why they would be willing to travel outside their local town or city for used a car our members’ top reason was that it saves money (24%). This was significantly higher for those who reside in London (30%).
Carguments
When respondents were asked what they did next after having an argument with someone in the vehicle with them whilst they were driving, over two in five (43%) respondents said that they carried on the trip in silence.
AA Panel members were asked when recalling those arguments, which from a given list of subjects, best describes what they were arguing about. Just under a third (32%) argued about the navigation of the car or being lost.
Secondly, a quarter of respondents (25%) said that how the car was being driven would best describe what they were arguing about.
Driving to work
With the cost of domestic energy rising, we asked our members if they already, or if they plan to make changes to their working practices (e.g. working from home/working in the office etc) from this Autumn/Winter?
Of those who work, over half (52%) said their job type did not allow them this option.
Nearly two in five (18%) said they are happy with the hybrid working arrangement they have with their employers, and a further 12% said they will decide nearer the time whether they will change their working habits.
A similar number indicated that they have always worked from home and will continue to do so.
We went on to ask how many miles our respondents who work drive to commute to their workplace. A third (33%) of respondents travel less than 10 miles to get to work.
Additionally, a quarter (25%) of AA Panel Members don’t use a car to get to work. This is significantly higher for those residing in London, where more than three in five (62%) of participants do not use a car to get to work.
MOT test knowledge
With over 31.5 million MOT tests carried out in the UK in 2021/22, we asked out panel what percentage they thought had failed the test initially.
The correct answer was 29%. Just over one in five of respondents chose the correct range (21 -30%) and a further 21% chose the 31 - 40% range.
15% of our members thought the failure rate was higher at 41-50%.
Next we asked what component categories our respondents thought would be the top reasons for failing the test. The correct answers were 1 = Lamps, Reflectors and Electrical Equipment, 2 = Suspension, 3 = Brakes, 4 = Tyres, 5 = Visibility.
The top reason chosen by AA Panel Members was ‘tyres’, with over two in five (43%) participants choosing this reason. The second top reason chosen was that of ‘brakes’, with just over a quarter (26%) of AA Panel Members choosing this option. Women (29%) were significantly more likely than men to choose this option (24%).
One in ten of our respondents ranked Lamps, Reflectors and Electrical Equipment as the top failure reason.
Highway Code knowledge
We ended our August survey with some questions about The Highway Code. Firstly we wanted to know if our members had familiarised themselves with the updates made in January 2022.
Over a third (39%) of participants had read these new rules, with over three in five participants aged 18-24 being significantly more likely to have (62%).
Three in five participants (61%) admitted that they hadn’t read these new rules, which was significantly higher for those residing in Northern Ireland, whereby over three-quarters (76%) had not.
We went on to ask which statements, from a given list, were included in the updates to The Highway Code.
The correct five answers to the ten given statement were:
- Leave at least 1.5 metres (5 feet) when overtaking people cycling at speeds of up to 30mph - 93% of respondents selected this.
- If a pedestrian is waiting to cross or has started crossing the road and traffic wants to turn into the road, the pedestrian has priority and all traffic should give way - 94% of respondents selected this.
- When exiting a vehicle and able to do so, drivers and passengers should open the door using their hand on the opposite side to the door they are opening. For example, using their left hand to open a door on their right-hand side - 69% of respondents selected this.
- Cyclists can ride two abreast, particularly in larger groups or when accompanying children or less experienced riders - 80% of respondents selected this.
- Drivers and motorcyclists should not turn into a junction if doing so would cause a cyclist, horse rider or horse drawn vehicle going straight ahead to stop or swerve - 93% of respondents selected this.
Yonder summary July 2022
There were 15,057 responses from AA members to its online poll between the 12th to 19th of July 2022.
In this survey
- Fuel prices
- Dream driving instructor
- Vehicle inspections
- Vehicle security
- Insurance experiences following a collision
- Spoiled Summer trips
Fuel prices
We opened our July 2022 survey by asking our panelists whether fuel economy would now be the most important criteria when choosing a car to buy this year. Almost a quarter (24%) said this would be be their primary criteria and this was more likely to come from members in the younger age brakets. Furthermore, 63% had this criteria in there top three considerations when choosing a car.
Respondents from London were more likely to indicate they would buy an EV if they were buying a car this year (7% in London, 4% nationally).
Over half of our members said they had made a conscious decision to travel less by car because, of the cost of petrol/diesel, this was significantly higher in women than men (58% vs 49%).
A fifth of respondents said they had made other cutbacks in other areas, and of these 80% had reduced how often they eat out.
We went on to show our panel a number of statements about driving behaviours to save money and asked which applied to them. The most agreed with statement was "'I have adapted the way I drive, perhaps reducing speed and driving more smoothly, to the extent that it has really cut my fuel consumption" with 31% agreeing to this. The next most agreed with statement was "'I have been smarter with my car use by combining trips, such as shopping when coming back from work" with 29% agreeing.
Dream driving instructor
On a lighter note, our panel members were then asked if they could have a driving lesson from a given list of famous people, who would they choose. The most selected was Lewis Hamilton (19%), followed by The Stig (15%) and Jeremy Clarkson (10%). While Lewis Hamilton and The Stig were more popular choices with women, Jeremy Clarkson rated higher among men.
Vehicle inspections
Respondents were asked how confident they feel when purchasing a used car from a dealer who is partnered with the AA as opposed to one who isn't. Over 7 in 10 (73%) felt confident in purchasing from a dealer who is partnered with AA as opposed to one who isn’t. A closer look shows 45% of AA panel members being more confident and 28% being much more confident. This is significantly higher amongst women (75%).
All respondents who would buy a used car were then asked if they would feel more or less confident purchasing a used car that had been independently inspected by the AA or would it make no difference. Overall, over 8 in 10 (85%) would feel confident.
Vehicle security
We asked our panellists who drive, if their vehicles had key less entry systems (where you do not need to enter a key into a lock or press a button on the fob in order to open the car). While most do not own vehicles with this feature, of those who do (27%), over half do not store their keys anywhere to increase security. Of those who take extra precautions with their keys, a fifth use a Faraday pouch and a further 9% put their keys in a metal box.
Insurance experiences following a collision
When respondents were asked about damage following a collision where they had to contact their insurance company, just under half (48%) said that the level of damage meant they were able to drive away from the scene before calling.
Of those who had been in a collision where damage was caused and they were required to contact their insurance company, almost three fifths (78%) respondents found that they could contact their insurance company easily. Only 5% of respondents found that their insurance company was too pushy.
Spoiled Summer trips
We ended our July survey by asking our members if they'd ever had days out (to a theme park for example) spoiled when taking the car. Almost 4 in 10 (38%) said that they had been delayed by traffic on the way there.
Additionally, just over a third (35%) said that they had experienced parking issues when they got to their destination.
Yonder summary June 2022
There were 14,288 responses from AA members to its online poll between the 14th to 21st of June 2022.
In this survey
- E-Scooters
- New home must haves
- Driving on the right
- Vehicle age and reasons for keeping older cars on the road
- Online speed awareness courses
- Pre Summer trip car checks
- Buying cars from a dealership
- Paying for parking
E-scooters
Our June questionnaire started with asking our members what they believe should be the minimum age for riding an E-scooter on public roads. The legal age in the UK to ride an E-scooter in public roads is 16 but, riders are required to have a full or provisional driving license. Almost half (48%) believe 18 should be the minimum age, followed by 16 (26%) and 17 (21%).
We went on to ask what kind of training, if any, should be required for people to ride e-scooters on public roads. 7 in 10 (70%) believed an in-person training and test should be required. Followed by online training and test (16%) and in-person training but no test (8%).
When asked about speed limits for e-scooters 46% think it should be 10mph, 29% think it should be 15mph and 15% think 12.5mph. Whilst just over 1 in 10 think 20mph should be the speed limit.
Finally for this section, we asked our members asked what mobility modes they would consider first to replace one or more of their car journeys per week. The top answer was bicycle with 47%, followed by e-bikes with 41%. Less than 1 in 10 (9%) would choose e-scooters for this.
New home must haves
Next we asked what our members considered to be new home ‘must haves’. A garden was considered most to be a ‘must have’ (60%). This was followed by a driveway (58%), a good internet speed (48%) and a garage (38%). For AA panel members a good school catchment area was considered as the least ‘must have’ (11%).
Driving on the right
Our panellists were then asked if they had driven a car in a country where they drive on the right. Over two thirds of respondents (69%) have driven a car in a country where they drive on the right. This is significantly higher for men when compared to women (76% vs 55%).
We went on to ask if those who had driven on the right had experienced any problems doing so. While the majority had experienced no problems, more than a third (37%) had found aspects stressful and almost 1 in 10 (9%) had, at some point, forgotten and driven on the wrong side.
Vehicle age and reasons for keeping older cars on the road
For this section of the survey, we wanted to gauge reasons for the high average car age in the UK. Most of our panellists who drive, own a car that is over 5 years old (68%), rising to 80% in 18 to 24 year olds.
The main reasons for having a car over 5 years old were that respondents didn't fell their car needed replacing (63%) and affordability (31%).
Online speed awareness courses
We opened the next section by explaining about the discretion that police forces have when issuing a fixed penalty notice, fine or a speed awareness course. When a speed awareness course is an opportunity, respondents were asked whether people should have the opportunity either do it online or in a physical classroom. Over half (54%) of respondents said yes to on line.
Pre Summer trip car checks
With Summer fast approaching, respondents were asked which of the following preparations they make before a long car journey in the Summer. Over 9 in 10 respondents (93%) have said that to prepare they will fill up with fuel. Secondly, 4 in 5 (80%) respondents have said that they will check their windscreen washer fluid.
Only 6% of AA Panel Members said that they check fuel prices using an online search tool.
Buying cars from a dealership
In this section we asked how confident our members feel when asking questions to a dealer about buying a car. 87% of respondents said that they felt confident; with over 9 in 10 (91%) men feeling confident, which is significantly higher than that of women (78%).
Only 13% of AA Members said that they would not feel confident when asking questions. This is far more significant for women, where more than 1 in 5 (21%) would feel unconfident compared to 8% of men.
Paying for parking
We rounded off the survey by asking how our members would prefer to pay for parking. Over 2 in 5 (43%) of AA Panel Members would rather pay for parking with a contactless payment (Contactless card, apple pay), significantly higher than the 17% of respondents who would want to use chip and pin.
Over 1 in 4 (26%) participants would prefer to use cash for their parking payments. This is significantly higher for those aged 65+, where just under a third (32%) would rather this method.
When thinking about parking, 7 in 10 (70%) respondents think that all car parks should accept cash and card as the minimum standard, complimenting this; 69% of respondents think that car parks should offer all methods of payment to provide flexibility towards all drivers.
Yonder summary May 2022
There were 13,062 responses from AA members to its online poll between the 17th to 24th of May 2022.
In this survey
- The Queen’s Platinum Jubilee
- The MOT Test
- Bus lane fines
- Electric vehicle purchase
- Autonomous vehicles
- Used car budgets
- Vehicle glass replacement
- Over 70s driving license renewals
- EV home charging
The Queen’s Platinum Jubilee
AA Panel members were asked if they expect to be driving on any day during the Jubilee weekend. Across all 4 days, almost half of respondents said they would not be driving on these days (average of 47% across the 4 days). Sunday was the day that most respondents were not planning to drive.
This was followed by almost 3 in 10 participants (28% - 2nd of June, 29% - 3rd of June, and 30% - 4th of June) saying they plan to drive somewhere else or have not yet decided.
1 in 5 (20%) respondents have said that they will be having a private barbecue with friends and family, but 43% said they won’t be celebrating or doing any of the activities listed. 10% plan to attend a street party.
The MOT Test
When asked how important the annual MOT is, 97% of AA Panel members believed it is important.
When asked whether they support the idea of changing the yearly MOT to every two years to help the cost-of-living crisis, 52% of AA panel members did not support the proposed idea compared to 38% who did support it.
When asked which statements they thought to be true or false from a given list about the current MOT scheme, the truest statements for respondents were “MOT test is a check that the vehicle meets a minimum required standard at that time” (98%). There is no significance to mention for this statement. Secondly, 97% of respondents deemed “Issues highlighted as dangerous and major will result in a failure” to be true.
The sta3ements considered the most false were “Having an MOT test is as good as having a car serviced (91%). 73% of respondents thought the following statement “Testers can make repairs and adjustments during the test” was false.
Bus lane fines
When asked whether they consider a £70 fine as a fair penalty for entering a bus lane, 63% said they do not consider it to be fair. When asked what they thought was an appropriate price for entering a bus lane, just under half (45%) of Panel members thought that a fine of less than £50 was an appropriate fee.
Electric vehicle purchase
The top reason considered by panellists for buying an electric vehicle was to help the environment (62%). The second most selected reason by respondents was lower fuel costs, selected by 54% of respondents.
The third most selected reason for buying an electric-vehicle was the reduction in congestion charges, with 32% of respondents.
Autonomous vehicles
When respondents were asked to what extent they agree or disagree with statements on technology, four-fifths (80%) AA Panel members agreed that they were worried such technology couldn’t cope with driving on our motorways, they were also concerned at how ALKS would react following a collision (80%); and that drivers should be required to undertake a short online course to understand the limitations and rules surrounding using such technology (80%).
Used car budgets
When asked what sort of budget they would set themselves if they were to buy a used car, 1 in 5 respondents (20%) set a budget between £10,000 and £14,999. Furthermore, when asked if this budget was lower this year than last year if they were to hypothetically buy a car, over 1 in 4 (26%) said yes.
Vehicle glass replacement
When appointing a glass repairer, just under half (49%) of respondents said that they would use a national glass repair company such as ‘Autoglass’. Going to a main dealer was a preference for only 3% of respondents.
Over 70s driving license renewals
We next asked participants, which of the following statements would they choose to become mandatory for drivers aged 70 and over to do when re-applying for a license. Just under two thirds of AA Panel members (64%) believe that once drivers reach the age of 70, they should have to have an eye test.
EV home charging
Almost three fifths (59%) of respondents agreed that the additional costs attached to install a home charger would put them off buying an electric vehicle. Secondly, over half (54%) of respondents agree that they would be worried that someone unknown to them could use their home ChargePoint whilst they are out.
Given that over a half of AA Panel members are worried that someone could potentially use their home ChargePoint; we asked all respondents – if you could use a PIN number to unlock your ChargePoint, what would you find most useful? Almost 4 in 5 respondents found that they would feel more confident in this as someone could not steal their electricity.
Yonder summary April 2022
There were 13947 responses from AA members to its online poll between the 11th to 19th of April 2022.
In this survey
- Car insurance
- Car ownership
- Heads up displays
- COVID effects on work
- Ideal vehicle type
- Personal climate action
- Holiday plans
- Used car buying
- Stressful driving scenarios
- Vehicle servicing
Car insurance
We opened this month’s survey by asking AA members how or where they buy their car insurance.
Almost 2 in 5 respondents (39%) said that they buy through a price comparison site, which was the top response to the question. Younger respondents aged 18-24 (71%) and 25-34 (65%) were most likely to buy insurance this way.
When considering buying an “essentials” or “basic” car insurance policy, less than 3 in 10 (27%) said that they would be likely to buy this type of policy however, younger respondents aged 18-24* (50%) and 25-34 (39%), would be more likely to opt for this policy than older age groups.
Car ownership
When respondents were asked about their household vehicle ownership status over the last 12 months, half of respondents (50%) stated that they only ever had one car over this time period.
Over 2 in 5 respondents (46%) have always had 2 cars or more, 2% said that they have sold cars to become a one car household.
Head-up displays
We asked respondents which items are partially or fully blocked from view on their dashboard. 2% of AA Panel members have a car with a “head-up display.”
Almost 9 in 10 participants (88%) said that they can see everything on their dashboard clearly, while 3% said that their Sat Nav directions are partially/fully blocked.
Of those with items blocked they included; technology enabled vehicle safety mechanisms, road sign recognition, engine management lights, the fuel gauge, the speedometer, and rev counter.
Respondents who can’t see everything on their dashboard clearly and don’t have a “head-up display” were asked to what extent they agree or disagree with the certain statements about these displays.
Respondents were split on whether they would want a “head-up display” on their next car, with 34% agreeing and disagreeing respectively.
COVID effects on work
There has been a lot of discussion in the media about how the pandemic has impacted working practices and contributed to more people changing their employer. Respondents were asked to think about their career and the times that they have changed employer.
A quarter of respondents (26%) said they have always worked for the same employer, therefore the question did not apply to them. The most prevalent reasons for leaving an employer were for more money (15%) as well as for a change in career direction (15%).
As more and more people transitioned to working from home during the pandemic, participants were asked which of the following would be the most important reason for working from home (if they had the option to do so).
The most important reason, given by 15% of respondents as their top answer, was to achieve a better work life-balance. This was followed by wanting to reduce fuel/motoring costs (6%) and to protect their own physical health (5%).
Ideal vehicle type
If money were no object, over a quarter (28%) of AA Panel members said that they would choose a self-charging hybrid vehicle.
1 in 5 respondents (21%) said that they would hypothetically choose an electric vehicle. Younger respondents aged 18-24* (40%), 25-34 (32%) and 35-44 (30%) would be significantly more likely than older respondents, especially those 65+ (18%), to choose this option.
Personal climate action
Respondents were asked their opinion on which measures taken by individuals would have the greatest impact on climate change.
Over half of respondents (53%) felt that using a renewable energy source to heat their home was the most impactful action to take. Half of respondents (50%) felt that more recycling was the best action that an individual can take, while 45% believed that buying more local produce would have the greatest impact.
Holiday plans
Respondents were asked about their holiday plans and whether the increase in fuel prices would influence the main mode of travel that they use for these holidays.
Just under a quarter of respondents (23%) said that they will be staying at home this year. Socioeconomic groups C2 (27%) and DE (34%) were significantly more likely to have no holiday plans this year.
Those respondents who were planning to fly on holiday or use another non-driving mode of travel were asked whether the cost of road fuel had influenced that choice. Over a third of respondents (36%) said that they will be flying off on holiday with their partner and that the high cost of fuel has not contributed to this decision.
Used car buying
AA Panel Members were asked which car finance products they perceived were available for second hand cars. Over 3 in 5 respondents (61%) believed a personal loan was available, while half (49%) believed a car purchase agreement was accessible, a third (34%) perceived a personal contract purchase to be available, and a quarter (26%) thought a personal lease was available. However, almost a third (31%) said they didn’t know.
Respondents were then asked to imagine that they were buying a used car from a dealership and were hypothetically interested in using car finance; what would they like to see the dealer offer to make this process easier/better?
The top answer chosen by over four in ten respondents (44%) was for the dealership to explain all the costs involved (from the monthly amount to any additional charges). Helping make sense of jargon, and the dealership telling the customer what commission they earn (7% each) were considered least important.
Stressful driving scenarios
When presented with various scenarios, respondents were asked to place these on a scale of 1 to 5, with 1 being very calm and 5 being very stressful.
Respondents found getting stuck in traffic the most stressful situation with over two in five respondents (44%) respondents saying they found this stressful.
Car breakdowns were considered less stressful than other situations, with one in ten finding ‘breaking down in heavy traffic’ stressful.
Vehicle servicing
With the cost of living rising, respondents were asked about their intentions for vehicle servicing. The top answer given by over three-fifths respondents (63%) was that they will get their vehicle serviced as normal.
Yonder summary March 2022
There were 14,467 responses to the AA Yonder survey between 15th and 22nd March 2022.
In this survey
- Vehicle servicing
- Holiday intentions 2022
- Rising fuel costs
- Easter getaway 2022
- Motorway service areas (MSAs)
- Roadside litter
- Road conditions
- Testing an EV
Vehicle servicing
We opened this month’s survey by asking AA members how they get their vehicle serviced. Over half said that they get their vehicle serviced at an independent garage (58%), whereas just under a third (31%) say they get their vehicle serviced at the main dealership.
Holiday intentions 2022
When we asked our members about their holiday intentions, 53% of AA Panel members said that they were having a holiday in the UK and plan to drive. This is significantly higher for those in the age bracket 35-44 (59%).
A fifth of respondents said they were not having a holiday this year.
When asked about the most important features of holiday insurance, over a third of respondents indicated that emergency medical cover was the top priority
Almost a fifth (21% female/15% male) said being covered for cancellations as a result of COVID 19 was the most important aspect of their holiday insurance.
Rising fuel costs
In the light of rising fuel costs, we asked our members who drive to what extent they monitor their vehicle's fuel consumption.
Around two-fifths of our motorist members (39%) said they monitor their fuel via their vehicle's on board systems and a further 29% said they can monitor their vehicles fuel, but don't monitor it closely.
Men were considerably more likely to keep an eye on their fuel use than women. Similarly older drivers (65+) are more likely to monitor it than younger drivers.
Given the increase in living costs; panel members were asked which statements, if any, they would use to describe any cutbacks they have made to reduce their household bills. Over half of respondents have agreed that they have reduced their heating and electricity usage at home (53%).
The second most popular ‘cutback’ was reducing the number of days/nights out, with more than a third of
respondents choosing this (34%). 18-24 year old’s were significantly likely to be choosing to cutback with over half of respondents reducing days/nights out (52%); this is contrasted by age group 65+ who are significantly less likely to cutback on days/nights out (27%).
Easter getaway 2022
The day our members were most likely to take a trip of some kind was Saturday, with 49% of drivers indicating they would drive on this day or were undecided. The rest of the Easter weekend was spread evenly with just over 40% indicating they would drive somewhere on those days.
Motorway service areas (MSAs)
To see how AA Panel members feel about motorway service areas, respondents were asked to agree or disagree on a scale some statements them.
Over half (57%) agreed that service areas are sometimes overcrowded and too busy.
The second most agreed statement is that there are enough toilets in motorway service areas, with just over half of respondents agreeing (55%). The third most agreeable statement is that the toilets are MSAs are generally tidy and clean with over half agreeing (54%)
We asked our panel to further rate the facilities at motorway stations from 0 (no interest) to 5 (essential). The most essential aspect of MSA’s consist of toilets which was rated a 5 by almost three quarters of AA Panel Members (71%)
Roadside litter
Panel members were asked to what extent they agree or disagree with statements regarding littering from vehicles. Littering from vehicles is a serious issue but can be difficult to prosecute if a local authority can’t identify the individual responsible. In 2018 local councils were given powers to issue a civil penalty notice to the vehicle’s registered keeper even though the keeper may not have thrown the litter and, indeed, may not have been driving at the time.
Over two thirds of AA Panel Members (64%) believe that it is unfair that the registered keeper is not able to name the passenger responsible for throwing the litter so that the right person gets the fine. Women are significantly more likely to agree with this statement (70% vs 61%)
The most disagreed with statement in regard to littering with just under two thirds of respondents
disagreeing (62%), is, where litter is branded (burger, chicken, coffee chain etc) the penalty should be imposed on the company rather than the individual.
Road conditions
Respondents were asked on a scale of 1 to 10, where 0 is terrible and 10 is excellent, how they rate the condition of road surfaces close to where they live
The roads that have the best condition surface and voted for by two-fifths respondents (41%), is that of motorways.
Whilst residential streets (roads used mainly for access to/from people’s homes) fell heavier into the net 4-7 category (47%), it had the highest net 0-3 out of all of the other options with over 43% of respondents categorising this way
We then went on to ask our members to rate road markings in the same way. Again, motorways got the best score. Almost a third of respondents rated residential streets as "terrible".
Testing an EV
Lastly, respondents were asked about hypothetically test driving an electric car and what they would like to learn about, understand and try before making the decision to buy one.
Three quarters of the respondents said they would like to learn how far they could go on a single charge(75%).
Yonder summary February 2022
There were 15,677 responses to the AA Yonder survey between 14th and 22nd February 2022.
In this survey
- Hitch-hiking
- Motorcycle safety
- Motability
- Used EVs
- Next car type
- Vehicle safety standards
- Horse road safety
- Car parking
- Paying for fuel
Hitch-hiking
We began our February survey by asking our panel how likely they would be to offer a hitch-hiker a lift at the roadside. While most would be unlikely to offer a lift (60%) of those indicating they would stop, most were men (11%) with women being significantly less likely to (2%).
Motorcycle safety
In the light of the updates to The Highway Code, we asked our panel who ride motorcycles if they felt the new rules and guidelines would make the roads safer for motorcyclists. The majority of our members who regularly ride motorcycles didn't feel the updates would make them safer (65%) with only just over a tenth saying they would feel safer. 4% were unaware of the updates.
Motability
Our next question focused on drivers that used a vehicle supplied by Motability and blue badge holders. Around 6% of our panel indicated that they either use a Motability vehicle or hold a blue badge.
Used EVs
We asked our members how they thought EVs held their value when compared to non electric vehicles. While the majority indicated they didn't know the answer, 14% thought the value of an EV would decrease more when compared to an ICE (Internal Combustion Engine) vehicle. 7% thought that EVs hold their value better than ICE vehicles.
We then went on to ask what, from a list of options, would put them off buying a used EV. The top answers were as follows:
- Concerns about the battery holding its charge 63%
- Concerns the range will decrease as it gets older 57%
- Concerns the battery may stop working 49%
- Concerns I may not be able to sell it on 26%
Next car type
Next, we asked AA members if they are planning to change their car in the next five years, which fuel their current car uses and what they expect to use for their next car.
Most of our members who own a car, use diesel (58%), with just over a third driving petrol cars. Hybrids, plug in hybrids and EVs make up the remaining 5%.
When choosing their next car, the largest portion of drivers (22%) expect to use petrol. One tenth expect to go to pure electric and almost a fifth will choose a hybrid option. Only 9% indicated they would choose a diesel car.
Vehicle safety standards
After Brexit and the government being given the opportunity to decide its own vehicle safety
standards. By July 2024, new model cars sold in the EU must include certain safety standards and
technologies and the UK government has yet to decide if it will adopt any of them. In light of this, we asked our members which of the following EU standards they think should be introduced into new model cars sold cross Great Britain. Some of the key results follow:
Horse road safety
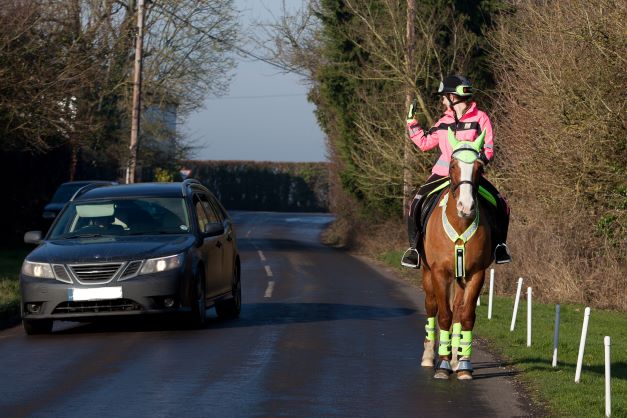
In light of the updates to The Highway Code last month which offer better protection for vulnerable road users, we asked AA members which way shows a safe way to pass a horse, from a list of images.
88% of respondents selected the below image (image courtesy of the British Horse Society)
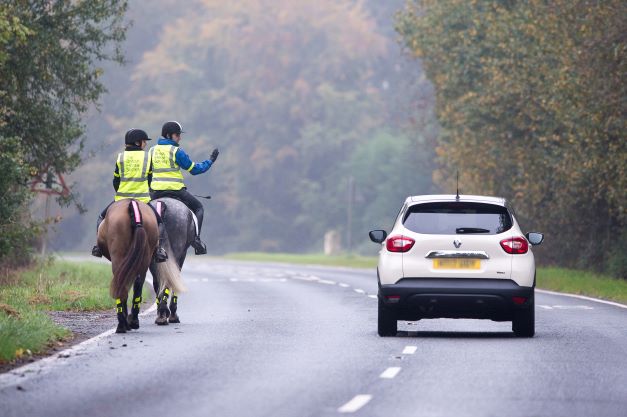
77% of respondents selected the below image (image courtesy of the British Horse Society)
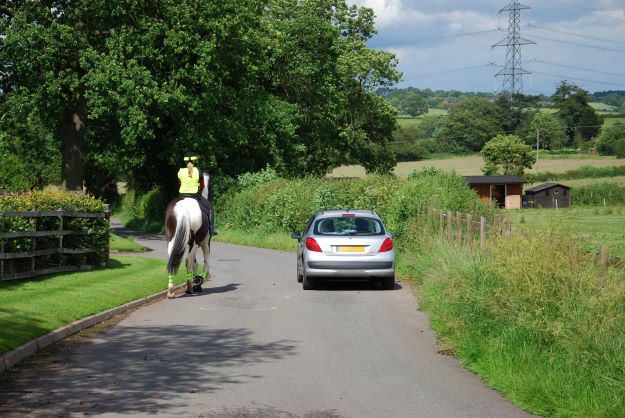
45% of respondents selected the below image (image courtesy of the British Horse Society)
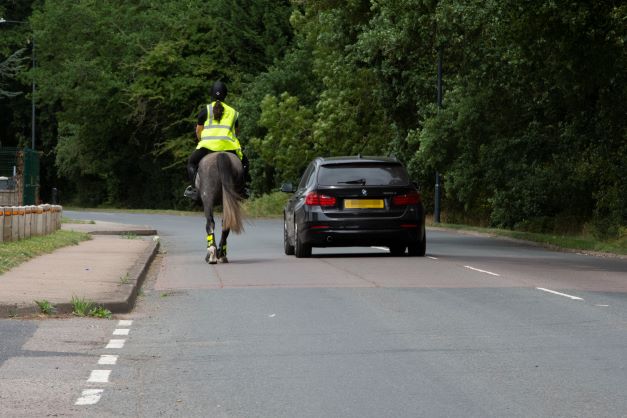
3% of respondents selected the below image (image courtesy of the British Horse Society)
The survey then went on to ask AA members what they thought the suggested safe distance and speed is to overtake a horse or horse drawn carriage, according to the updated Highway Code. 59% of respondents said at 10 mph and 2m distance, 14% said at 15mph at a 2m distance, 7% said at 10 mph at a 1.5m distance, 2% said at 15 mph at a 1.5m distance and 18% don’t know.
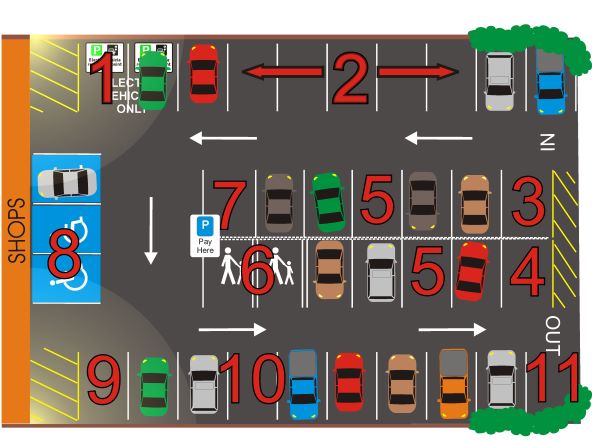
Car parking
The survey then showed AA members an image of a car park and asked them to imagine they were going shopping alone in the dark and tell us which zone they would park in. The largest group of AA respondents chose Zone 2 (43%). 21% chose zone 7, 18% for zone 9.
Paying for fuel
We next asked our panel who drive, how they go about refuelling their vehicles
The majority of respondents(82%) indicated that they do not put in a set amount with men being slightly more likely in this case (83%) than women (81%).
Only 17% of AA members said they put in a set amount, with women (19%) being more likely to do so than men (16%).
In light of the rising fuel prices we asked AA members who put in a set amount if they had changed how much they put it. The majority (68%) said they have not changed. 35% said they have not changed the set amount but drive less often
| EU standards | % saying yes | % saying no |
| Advanced Emergency Braking (AEB) | 74% | 8% |
| Emergency Stop Signal automatic hazard lights after an emergency braking event | 73% | 13% |
| Lane Departure Warning and Lane Keeping Assist | 61% | 21% |
| Lane Departure Warning and Lane Keeping Assist | 61% | 24% |
| Intelligent Speed Assistance | 49% | 24% |
Yonder summary January 2022
There were 13,746 responses to the AA Yonder survey between 8th and 18th January 2022.
In this survey
- Winter driving
- EV driving lessons
- Buying and owning an EV
- Fuel prices
- The Highway Code
- Driver assistance systems
- Council spending
- Insurance priorities
Winter driving
We began the January 2022 survey by asking our members who drive, how they would adjust their driving should it begin to snow. From a list of statements, most selected the option indicating they would slow down a little and increase the distance to other vehicles.
Next we asked the same group, how confident they feel driving in certain wintry conditions. Our panel feel most confident driving in thunder and lightning, with over half of men choosing this option (51%) and around a quarter of women responding the same (26%).
We closed this section by asking our drivers where they would clear snow from their cars after a downfall of 10cms had settled. Unsurprisingly, the vast majority said they would clear the windscreen but only just over 7 in 10 said they would clear the roof (72%).
EV driving lessons
In light of the government announcing the ban on the sale of all new petrol and diesel engine cars from 2030, we asked AA members when they think all driving lessons will be in an electric vehicle.
The top answer, with 24% was after 2035. A fifth of respondents thought the date would be closer to 2030 and just over a tenth(11%) said 2028.
— We then asked AA members to choose from a list of options which they think would encourage more young drivers to drive an EV. The majority said cheaper insurance for electric vehicles (78%), followed by financial incentives/grants to help buy an EV (77%. Almost half (49%) said learning to drive in an electric vehicle would provide encouragement.
Buying and owning an EV
In light of the government recently cutting the grant available for purchasing a new electric car and the change in the eligibility criteria starting April 2022 for the other grants available, we asked AA members if they think there is enough support to help drivers switch to an electric vehicle. 78% of respondents answered no, making up the vast majority, while only 5% said yes.
We then asked our members which, from a list of points, would be most important to them following a collision if they own an EV. The top answers were as follows:
- Cost of repairs (62%)
- Safe repair/replacement of the main driving battery (52%)
- Specialist EV trained mechanics carrying out mechanical repairs (e.g. wishbones, suspension etc.) (49%)
- Readily available parts (45%)
- Manufacturers approval of the garage to repair their EV (41%)
Fuel prices
We asked respondents who drive where they usually buy fuel from, with the majority saying they buy fuel at a supermarket (62%). Women were more likely (64%) to do so than men (61%). This option was also more popular with drivers from the East Midlands (70%) than other regions.
We asked our members who buy their fuel at a supermarket or non-supermarket, if they are satisfied that their usual fuel supplier’s price fairly reflects the recent fall in petrol and diesel wholesale costs. The majority (54%) said they are aware the wholesale costs have fallen but are not satisfied with price reduction at their usual fuel station.
The Highway Code
In light of the media coverage advising people what the new rules are, regarding changes to the
Highway Code, we asked AA members if that have looked at the new rules which will be adopted later this month. 68% of AA members said they had not looked at the changes, with 35% being aware of the changes but not having read them and 29% unaware of any changes to the Highway Code. Around a third (32%) of respondents said that they had looked at them with men being more likely (34%), to have looked at then, than women (28%).
Driver assistance systems
We asked AA members to tell us which technologies their cars are equipped with and how often they use them. The top answers were as follows:
- Parking sensors - 57%
- Automatic headlamps - 52%
- Automatic windscreen wipers - 52%
- Preconditioning (heating/air con) - 38%
- Cruise control - 33%
Council spending
As local councils are currently finalising their budgets for the 2022/23 financial year, and the fees and charges for various services, we asked AA members to tell us, from a list of different services, what they expect their local councils to increase or decrease.
The most popular selections were:
- Short stay car park fees 59% said would increase
- Long stay car park fees 59%said would increase
- Car park season ticket said would increase
- Residential parking permits 42% said would increase
- Park & Ride fees 39% said would increase
Insurance priorities
Our final question for this month, asked AA members what the most important factor is when buying motor insurance, asking them to rank different statements in order of importance.
The most important factors AA members consider when buying insurance were the level of cover being provided (29%) as well as choosing an insurer they know and trust (29%). The level of cover was more important to those aged between 55 and 64 years and choosing an insurer you could trust ranked higher in the over 65 segment